Daniocell
mmd2a (pronephros)
monocyte to macrophage differentiation-associated 2a
ZFIN
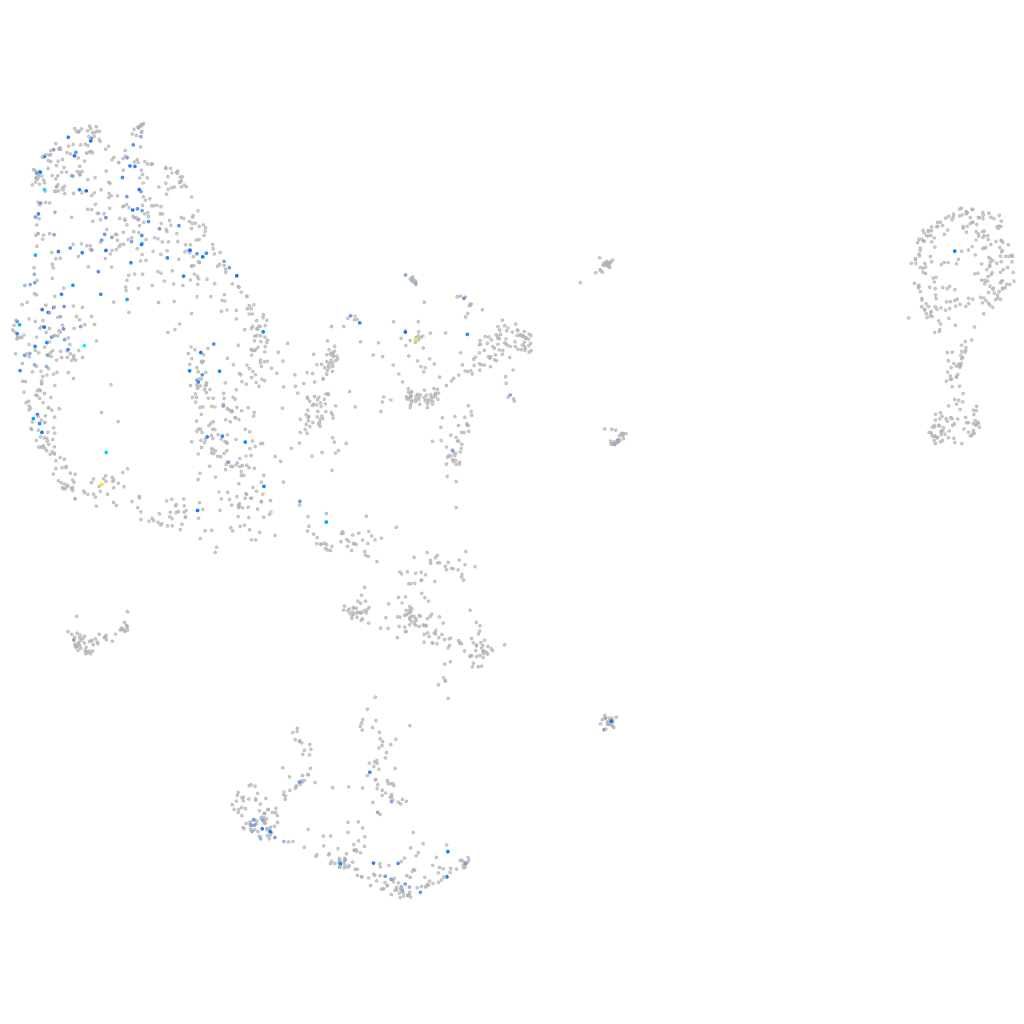
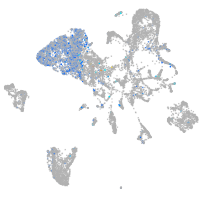
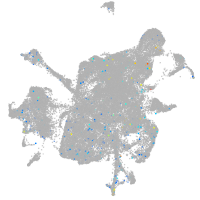
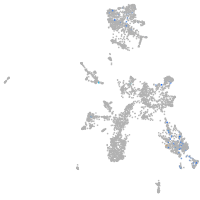
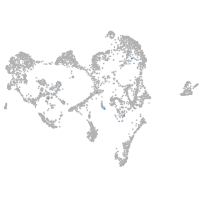
Gene expression UMAP
Display:
Expression
Stage
Other cell groups
all cells
blastomeres
PGCs
endoderm
axial mesoderm
muscle
mural cells /
non-skeletal muscle
mesenchyme
hematopoietic /
vasculature
pronephros
neural
spinal cord / glia
eye
taste / olfactory
otic / lateral line
epidermis
periderm
fin
ionocytes / mucous
pigment cells
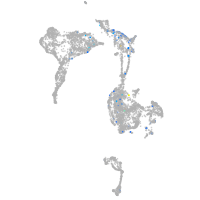
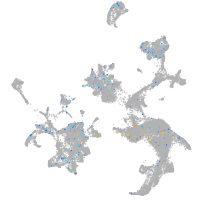
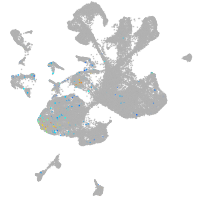
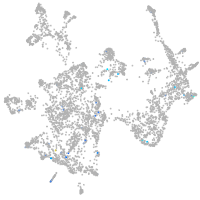
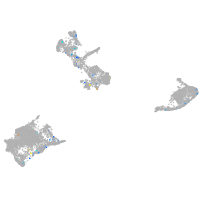
Expression by stage/cluster
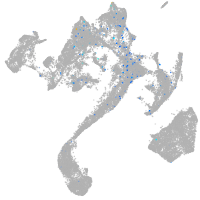
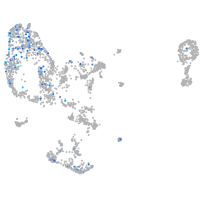
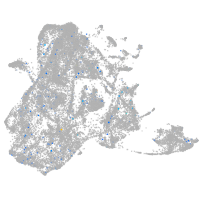
Correlated gene expression
Positive correlation
Negative correlation
Gene
r
Gene
r
ccl27a
0.261
si:ch211-222l21.1
-0.179
sod3b
0.254
si:ch73-1a9.3
-0.174
si:dkey-279j5.1
0.248
hmgb2a
-0.157
XLOC-010278
0.246
h3f3d
-0.155
XLOC-040812
0.227
ptmab
-0.154
LOC110439365
0.226
hmgn2
-0.152
slc13a3
0.226
h2afvb
-0.149
si:ch211-201h21.5
0.224
hmga1a
-0.149
LOC101882114
0.223
si:ch73-281n10.2
-0.145
si:ch73-361p23.3
0.221
hnrnpaba
-0.142
aco1
0.220
nucks1a
-0.137
slc5a11
0.217
tubb2b
-0.137
pyroxd2
0.216
khdrbs1a
-0.137
tbxa2r
0.216
cirbpb
-0.136
LOC101886255
0.215
seta
-0.132
slc22a4
0.215
hspb1
-0.131
haao
0.211
hmgn6
-0.130
glud1b
0.210
hmgb1b
-0.129
tcima
0.208
marcksb
-0.127
agxtb
0.207
marcksl1b
-0.126
gapdh
0.207
setb
-0.126
dglucy
0.206
cirbpa
-0.125
si:dkey-148d16.5
0.205
hnrnpabb
-0.124
slc15a2
0.205
hmgb3a
-0.122
dhdhl
0.202
ilf3b
-0.119
aldh16a1
0.202
rbm8a
-0.118
SLC5A10
0.201
si:ch211-51e12.7
-0.118
acy1
0.199
wu:fb97g03
-0.117
cat
0.199
hmgb2b
-0.117
chia.2
0.199
h2afva
-0.116
g6pca.2
0.199
sumo3a
-0.115
slc16a12b
0.198
top1l
-0.115
gpt2l
0.198
snrpd3l
-0.114
tmprss2
0.198
hnrnpa0a
-0.112
fbp1b
0.198
anp32a
-0.111