Daniocell
mier3a (otic / lateral line)
"mesoderm induction early response 1, family member 3 a"
ZFIN
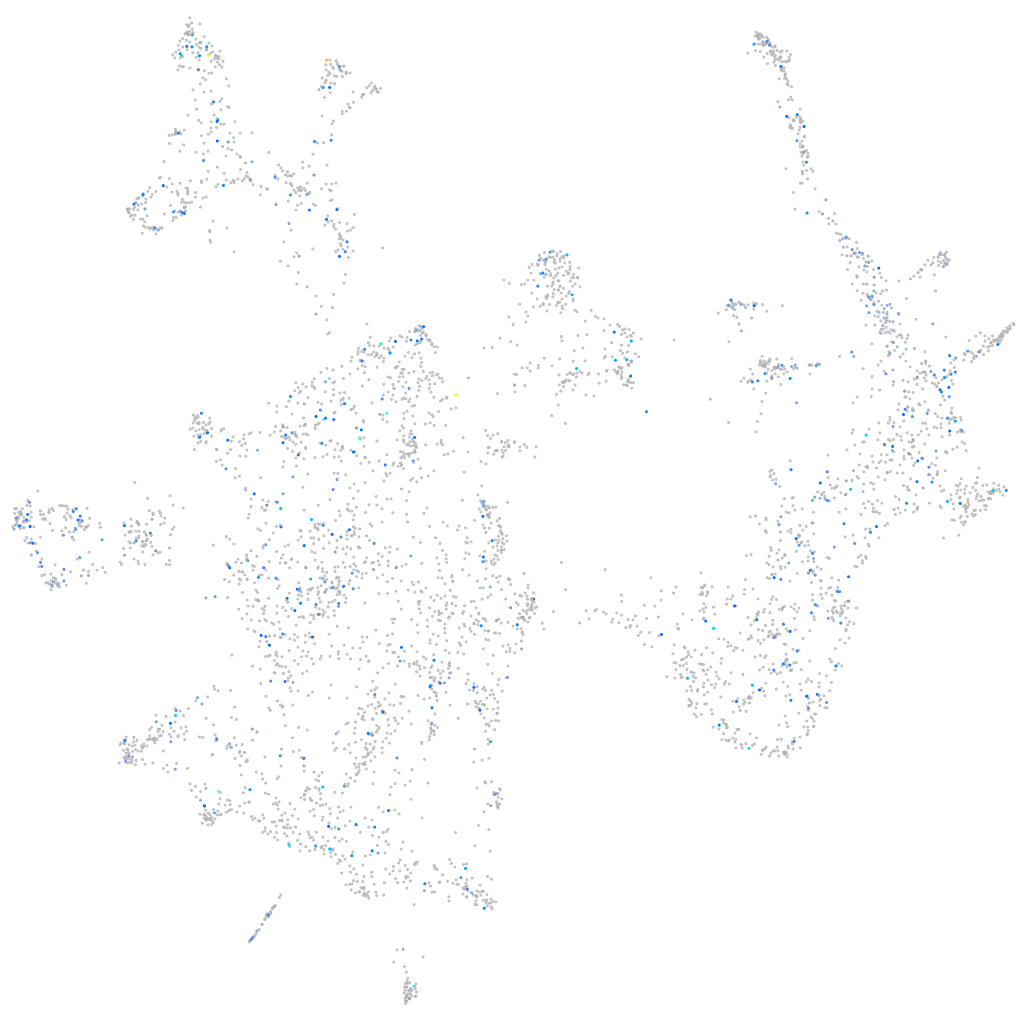
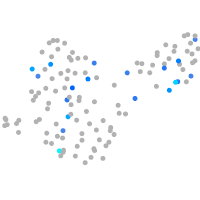
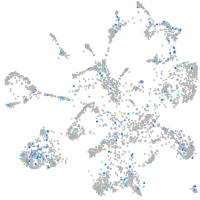
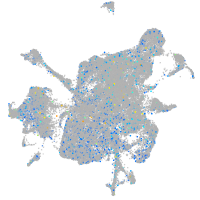
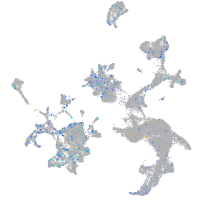
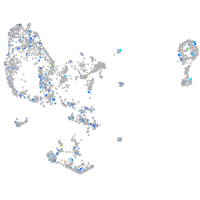
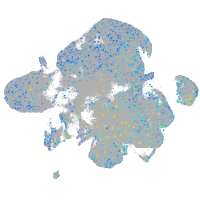
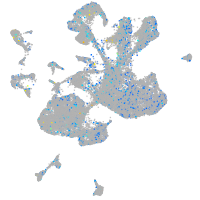
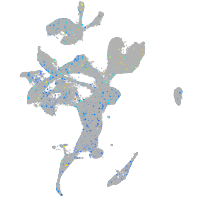
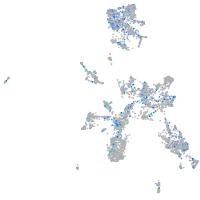
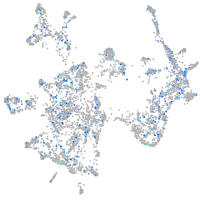
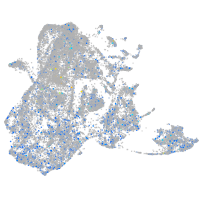
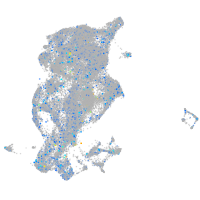
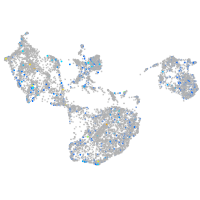
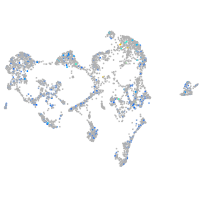
Gene expression UMAP
Display:
Expression
Stage
Other cell groups
all cells
blastomeres
PGCs
endoderm
axial mesoderm
muscle
mural cells /
non-skeletal muscle
mesenchyme
hematopoietic /
vasculature
pronephros
neural
spinal cord / glia
eye
taste / olfactory
otic / lateral line
epidermis
periderm
fin
ionocytes / mucous
pigment cells
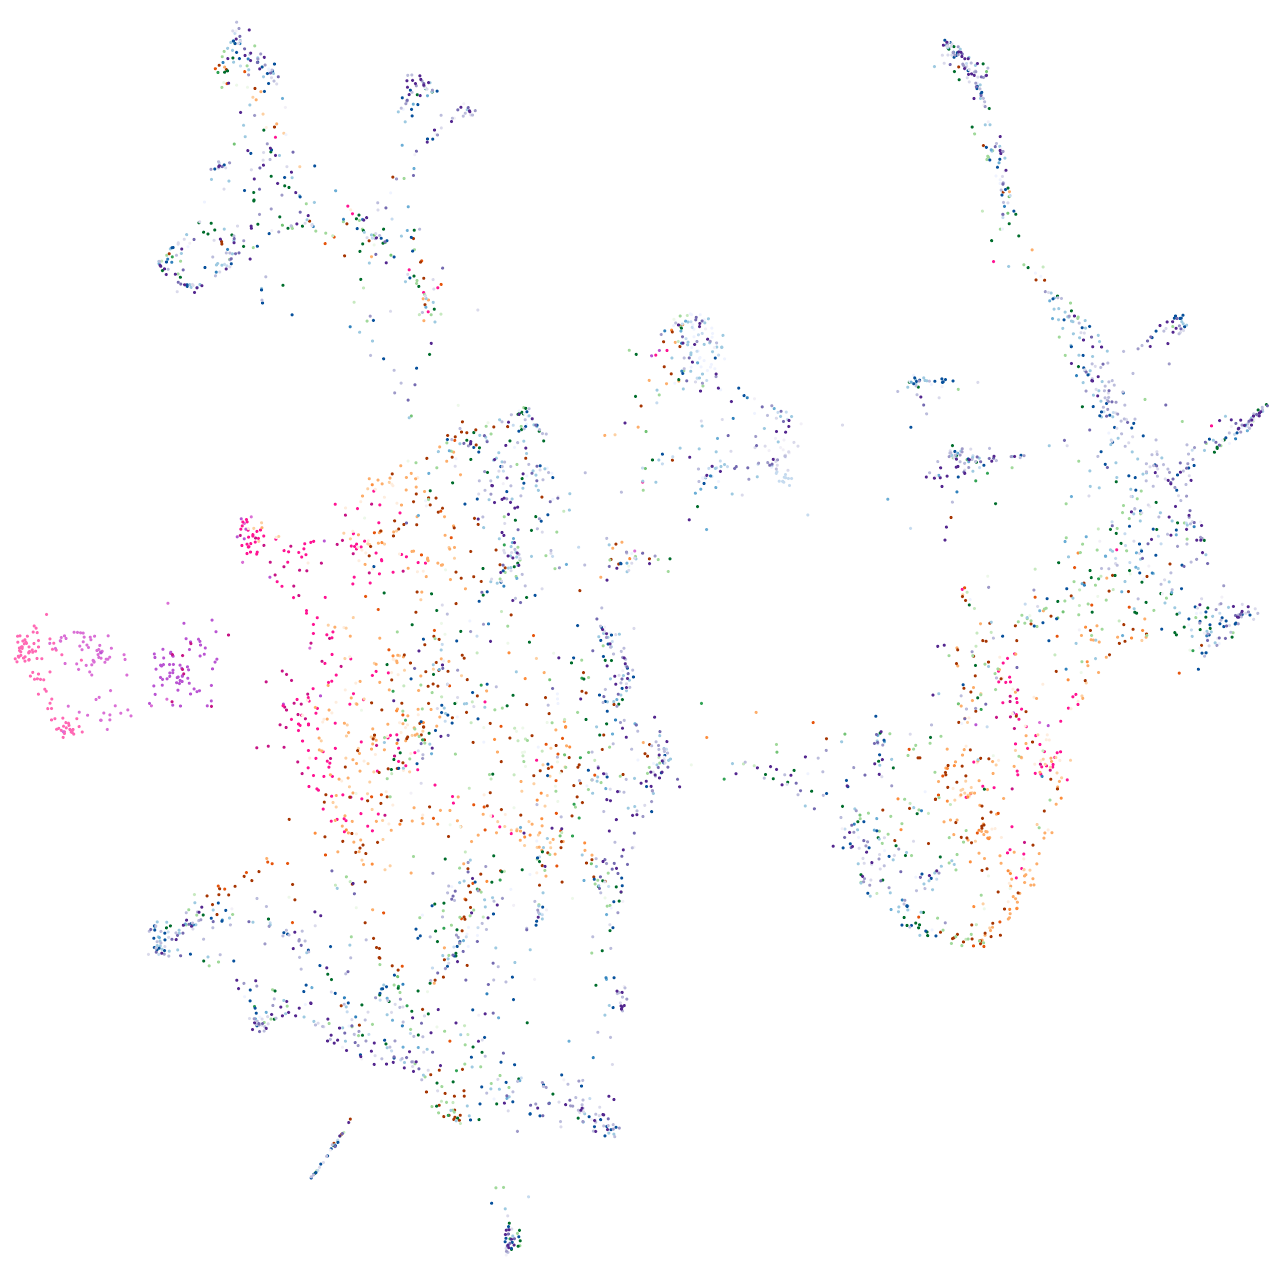
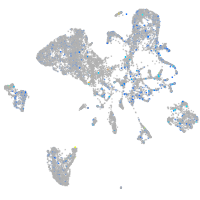
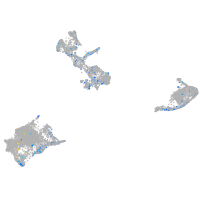
Expression by stage/cluster
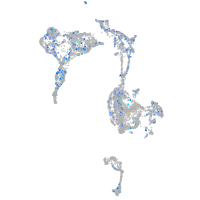
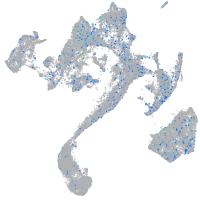
Correlated gene expression
Positive correlation
Negative correlation
Gene
r
Gene
r
LOC108179813
0.153
zgc:114188
-0.039
BX005085.2
0.151
rps11
-0.038
CR812470.2
0.148
rpl38
-0.037
LOC101886884
0.141
si:ch211-80h18.1
-0.036
pfkmb
0.123
rpl28
-0.036
znf1045
0.122
rgrb
-0.035
LOC101885678
0.121
tspan18a
-0.035
zgc:110789
0.120
si:ch211-74m13.3
-0.035
cfbl
0.118
dram2b
-0.035
ccdc9b
0.114
otomp
-0.034
LOC108191933
0.104
si:dkey-151g10.6
-0.034
LOC101885065
0.103
wfdc2
-0.034
gstk4
0.103
wif1
-0.034
BX088728.1
0.102
tmeff2a
-0.034
si:dkey-4c15.16
0.099
rassf8a
-0.034
LOC110438921
0.098
si:ch73-263o4.4
-0.033
LOC100537538
0.095
col11a1a
-0.033
pimr204
0.094
myl9a
-0.032
zgc:91944
0.094
zgc:66443
-0.032
apbb1ip
0.094
cyr61
-0.032
kdm2aa
0.094
gngt2b
-0.032
CR847897.1
0.094
rgs7a
-0.032
hbae5
0.094
rps25
-0.032
znhit2
0.093
zgc:65997
-0.032
CR854941.1
0.093
dync1i1
-0.031
zfand4
0.092
gnb3a
-0.031
tm7sf2
0.091
bnc2
-0.030
p2rx2
0.090
tnni2a.4
-0.030
XLOC-020170
0.089
col9a3
-0.030
LOC792447
0.089
fbn2a.1
-0.030
si:ch73-256j6.3
0.089
MARK4
-0.030
zgc:194887
0.089
chchd3b
-0.030
BX005085.6
0.088
col2a1a
-0.030
si:dkey-264f17.4
0.088
si:dkeyp-44a8.4
-0.029
CR391910.2
0.087
cox4i2
-0.029