Daniocell
mhc1zba (otic / lateral line)
major histocompatibility complex class I ZBA
ZFIN
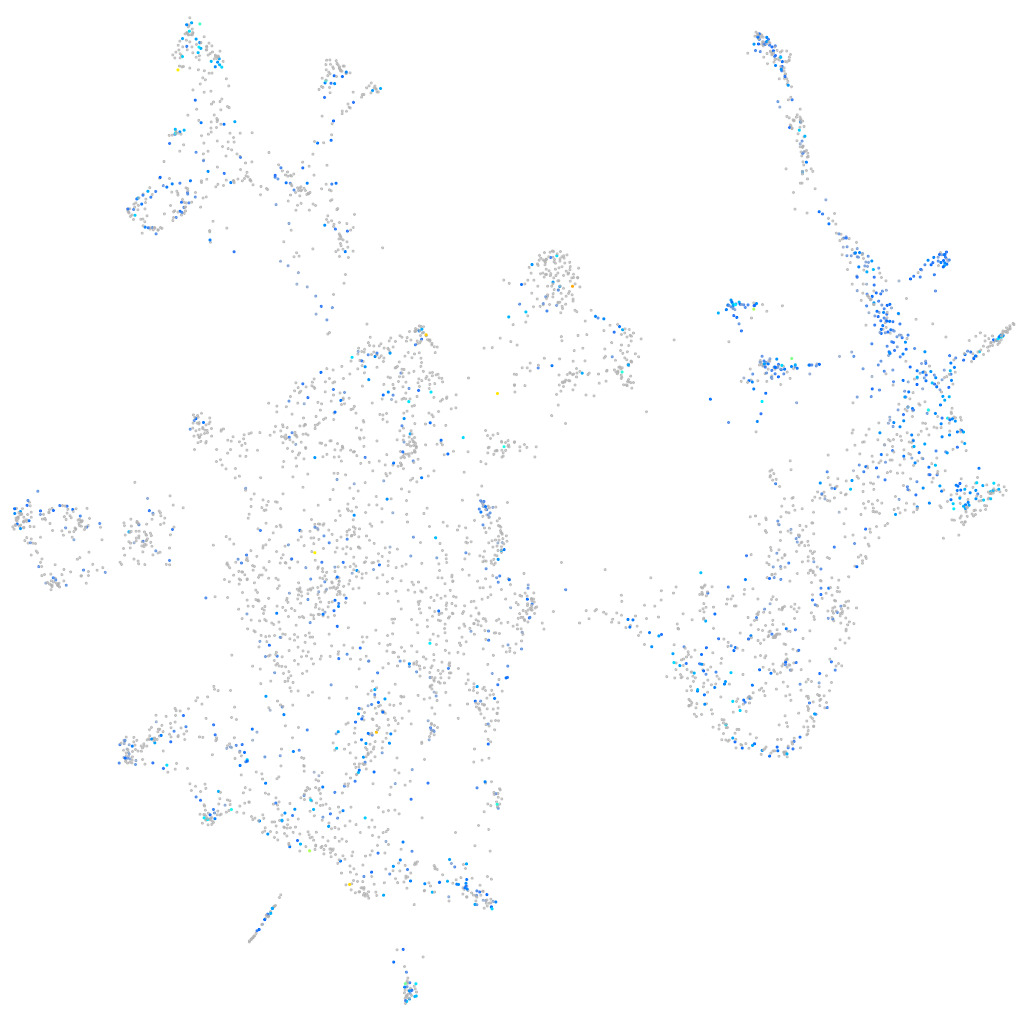
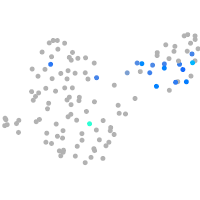
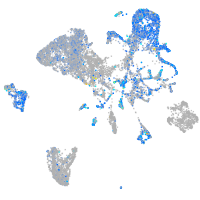
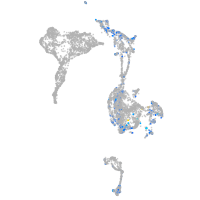
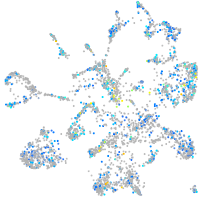
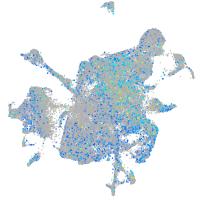
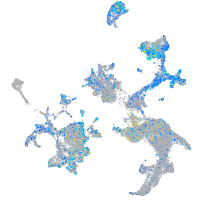
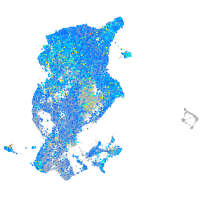
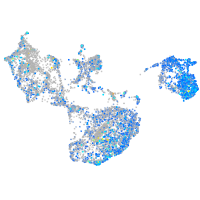
Gene expression UMAP
Display:
Expression
Stage
Other cell groups
all cells
blastomeres
PGCs
endoderm
axial mesoderm
muscle
mural cells /
non-skeletal muscle
mesenchyme
hematopoietic /
vasculature
pronephros
neural
spinal cord / glia
eye
taste / olfactory
otic / lateral line
epidermis
periderm
fin
ionocytes / mucous
pigment cells
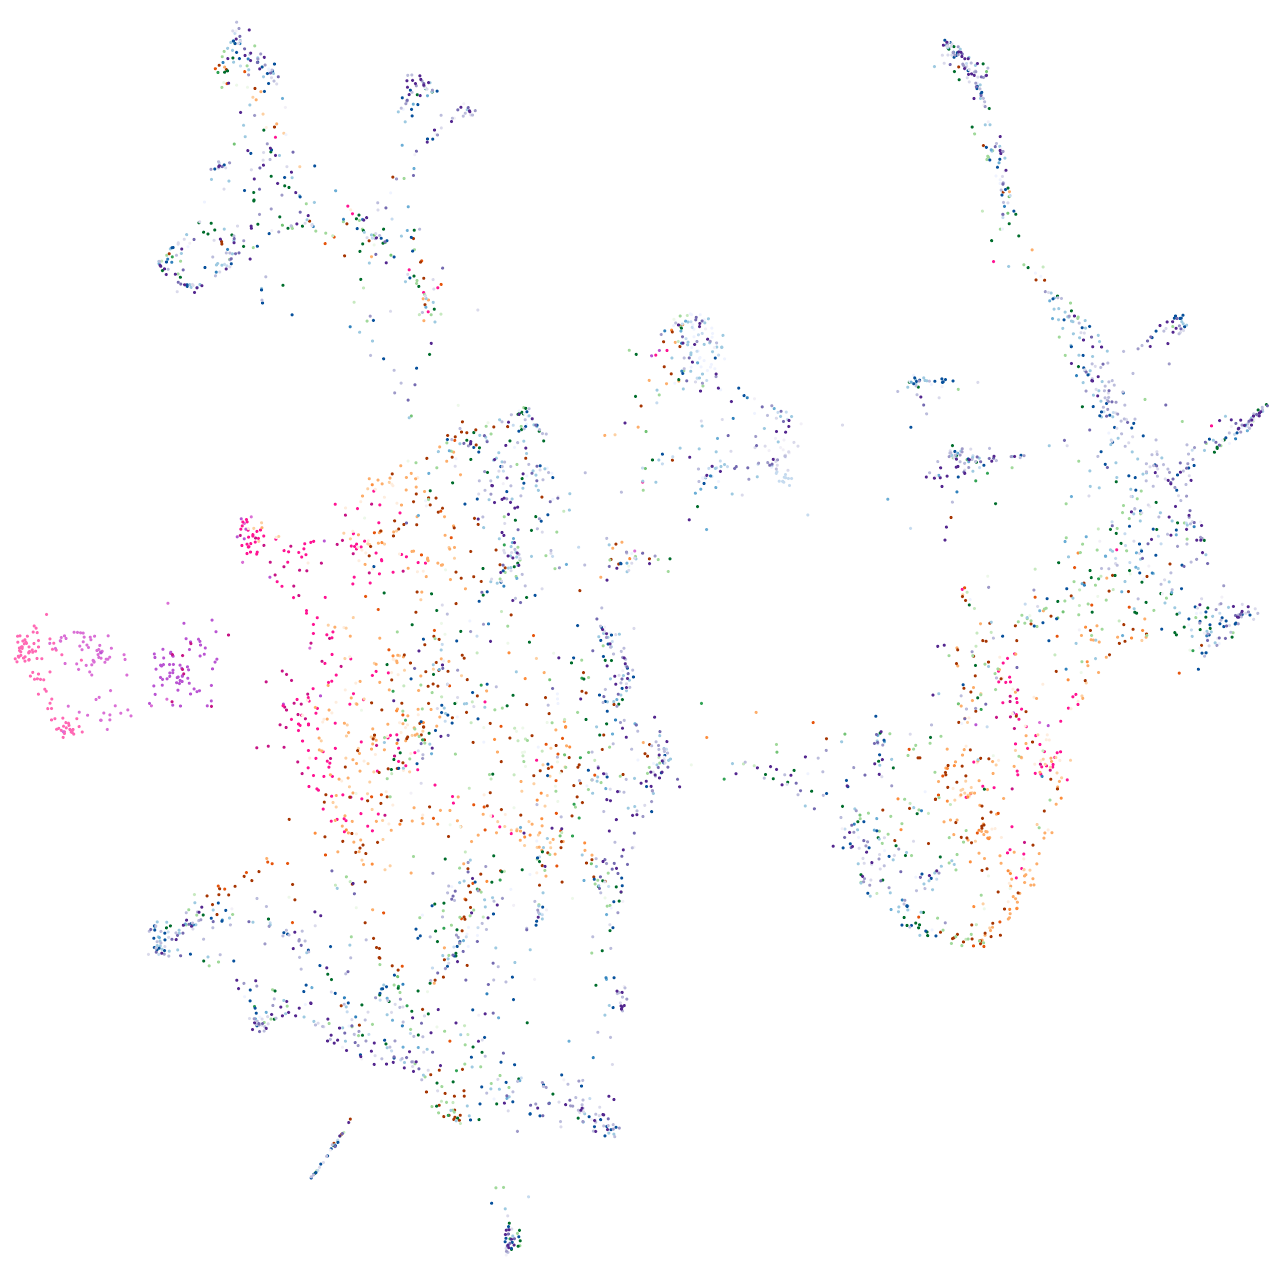
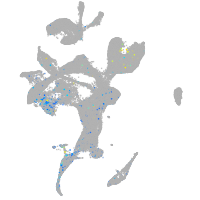
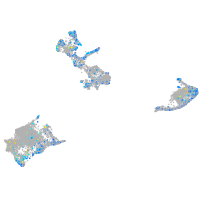
Expression by stage/cluster
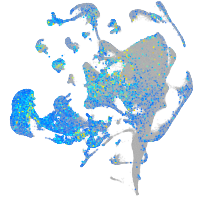
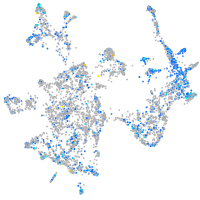
Correlated gene expression
Positive correlation
Negative correlation
Gene
r
Gene
r
tmem176l.4
0.257
si:ch211-222l21.1
-0.167
si:dkey-205h13.2
0.246
hmga1a
-0.147
ucp2
0.240
apex1
-0.132
si:dkey-103g5.3
0.238
nucks1a
-0.129
zgc:162730
0.236
zbtb16a
-0.125
negaly6
0.235
si:ch211-51e12.7
-0.123
zgc:158343
0.234
si:dkey-151g10.6
-0.122
zgc:154054
0.230
si:ch73-1a9.3
-0.122
hopx
0.229
h2afvb
-0.120
elf3
0.229
rps29
-0.120
soul2
0.225
oc90
-0.120
zgc:193505
0.221
rps28
-0.116
pycard
0.219
marcksb
-0.113
LOC100536887
0.218
rplp2l
-0.113
tcnbb
0.218
snrpf
-0.109
wu:fb18f06
0.218
mcm7
-0.109
arg2
0.217
si:ch211-288g17.3
-0.108
si:ch73-335l21.4
0.217
snrpg
-0.106
zgc:153911
0.216
hnrnpa0b
-0.106
mcl1a
0.213
hmgb2b
-0.106
gbgt1l3
0.212
rpl37
-0.105
s100v2
0.211
NC-002333.4
-0.105
cmah
0.211
abcf1
-0.105
si:ch211-103f14.3
0.211
rpl36a
-0.104
wu:fj16a03
0.210
ddx39ab
-0.104
irg1l
0.208
sae1
-0.103
tagapa
0.208
rps21
-0.103
nfe2l2a
0.207
rpl29
-0.102
abca12
0.206
stm
-0.102
tmsb1
0.206
rpl38
-0.102
si:ch211-195b11.3
0.204
ptges3b
-0.101
prss60.2
0.204
sub1a
-0.099
cfl1l
0.203
hbbe3
-0.099
rorb
0.203
rcor2
-0.099
ier2b
0.203
snrpd1
-0.098