Daniocell
mcf2la (blastomeres)
mcf.2 cell line derived transforming sequence-like a
ZFIN
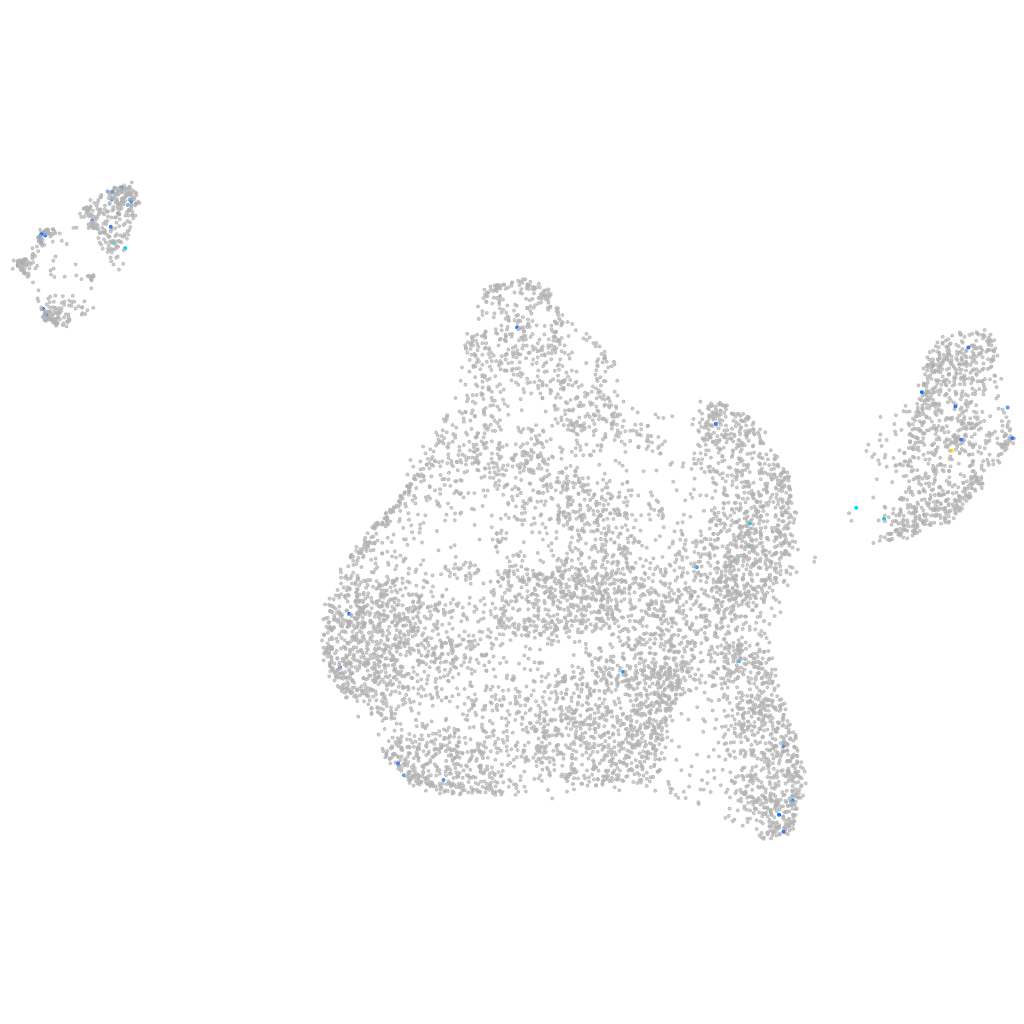
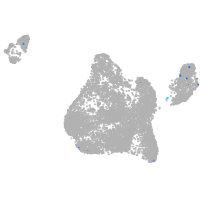
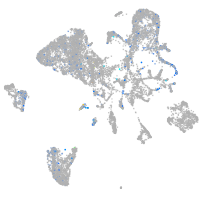
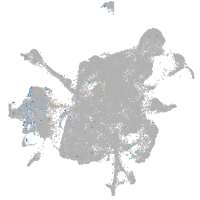
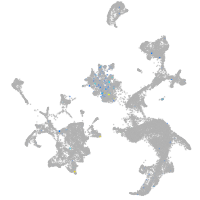
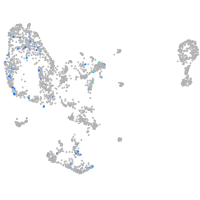
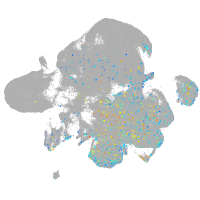
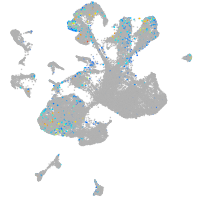
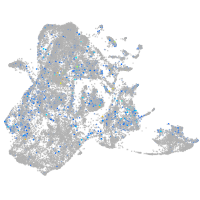
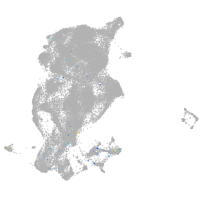
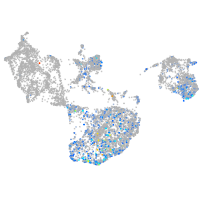
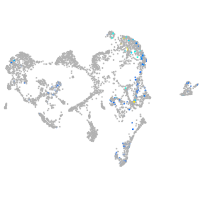
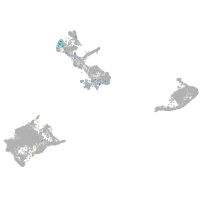
Gene expression UMAP
Display:
Expression
Stage
Other cell groups
all cells
blastomeres
PGCs
endoderm
axial mesoderm
muscle
mural cells /
non-skeletal muscle
mesenchyme
hematopoietic /
vasculature
pronephros
neural
spinal cord / glia
eye
taste / olfactory
otic / lateral line
epidermis
periderm
fin
ionocytes / mucous
pigment cells
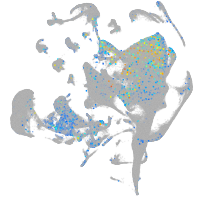
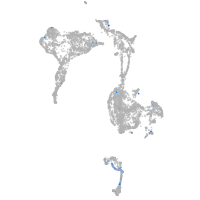
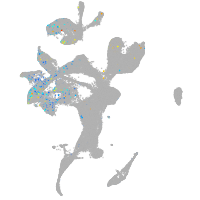
Expression by stage/cluster
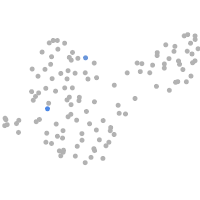
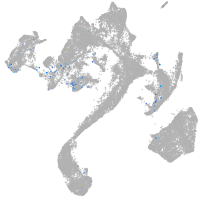
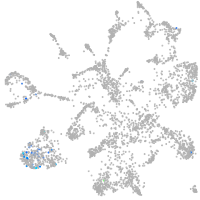
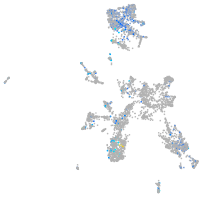
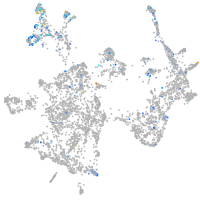
Correlated gene expression
Positive correlation
Negative correlation
Gene
r
Gene
r
BX571762.2
0.234
si:ch73-1a9.3
-0.101
rereb
0.219
marcksl1b
-0.095
igsf5b
0.218
si:ch211-152c2.3
-0.093
dpep1
0.217
hnrnpa0b
-0.091
si:ch211-286b4.4
0.207
ybx1
-0.090
gpr4
0.180
hmgn6
-0.088
si:dkey-206d17.15
0.177
eef1a1l1
-0.084
hsf5
0.165
aldob
-0.082
BX571780.1
0.159
rplp1
-0.081
runx3
0.157
hspb1
-0.080
LOC108180776
0.156
si:ch211-222l21.1
-0.077
atxn7l1
0.153
hmga1a
-0.076
aasdh
0.149
si:dkey-151g10.6
-0.075
ahrrb
0.139
stm
-0.074
pgm2l1
0.137
polr3gla
-0.074
XLOC-005083
0.137
khdrbs1a
-0.073
si:ch211-59d17.3
0.135
rplp0
-0.073
LOC101882853
0.132
si:dkey-56m19.5
-0.073
LOC101886442
0.131
rps5
-0.072
LOC103910439
0.130
cirbpb
-0.071
si:dkey-7e14.3
0.126
dynll1
-0.070
si:dkey-166k12.1
0.124
rps6
-0.069
srd5a3
0.122
rplp2l
-0.069
vsnl1b
0.119
rpl36
-0.069
nfixb
0.116
rpl7
-0.069
AL954698.1
0.113
rps8a
-0.069
si:ch211-214p13.9
0.112
anp32e
-0.069
BX323593.1
0.111
hmgb2a
-0.068
zgc:153184
0.109
si:ch1073-80i24.3
-0.067
si:ch211-214k5.3
0.107
snrpf
-0.066
fhl1b
0.106
rps2
-0.066
fhod3b
0.106
rpl26
-0.064
slc25a34
0.106
naca
-0.063
pdgfra
0.103
rps13
-0.063
pdgfc
0.102
npm1a
-0.062