Daniocell
march6 (fin)
membrane-associated ring finger (C3HC4) 6
ZFIN
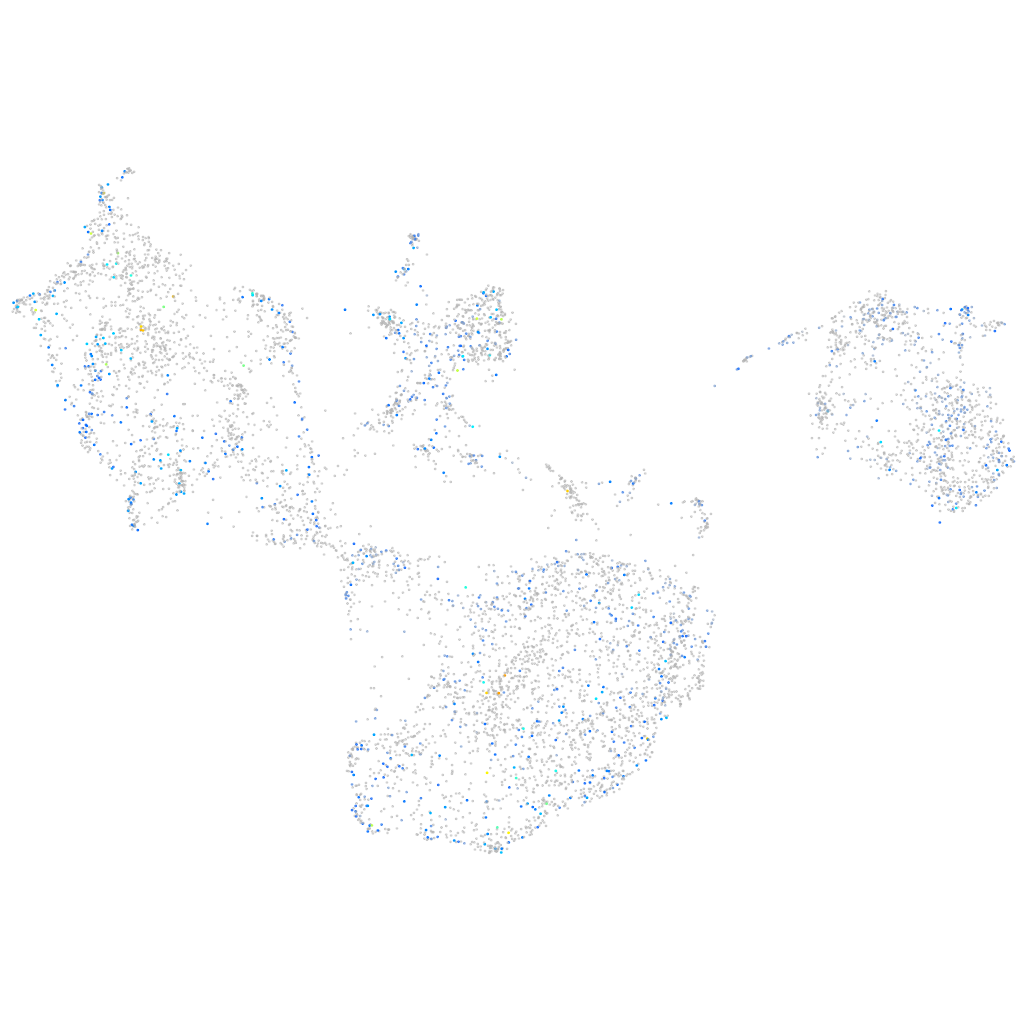
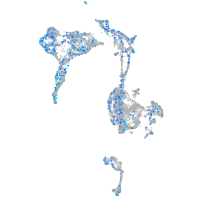
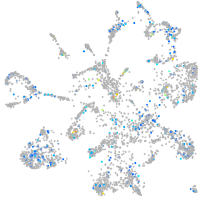
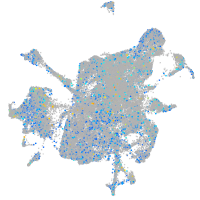
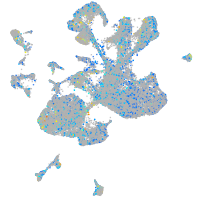
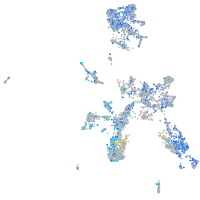
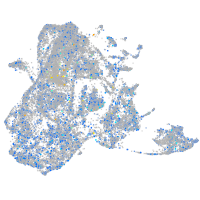
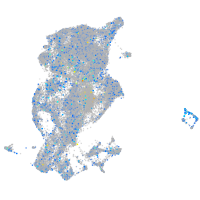
Gene expression UMAP
Display:
Expression
Stage
Other cell groups
all cells
blastomeres
PGCs
endoderm
axial mesoderm
muscle
mural cells /
non-skeletal muscle
mesenchyme
hematopoietic /
vasculature
pronephros
neural
spinal cord / glia
eye
taste / olfactory
otic / lateral line
epidermis
periderm
fin
ionocytes / mucous
pigment cells
Expression by stage/cluster
Correlated gene expression
Positive correlation
Negative correlation
Gene
r
Gene
r
wdr78
0.122
si:dkey-151g10.6
-0.043
LOC108181470
0.121
rplp1
-0.043
c18h15orf65
0.121
nme2b.2
-0.042
ccdc175
0.119
rplp2l
-0.038
si:dkey-163f12.6
0.117
krt5
-0.034
si:ch73-174h16.5
0.111
serpina1l
-0.033
tnfsf14
0.107
mylz3
-0.032
BX248410.3
0.106
rpl39
-0.030
runx2b
0.102
si:ch211-255p10.3
-0.030
LOC101884649
0.102
pvalb2
-0.030
si:dkey-114c15.5
0.099
rpl38
-0.030
iqcg
0.099
rps13
-0.029
CT573139.1
0.098
trmt61a
-0.029
rasgrf2a
0.098
itgb1b.2
-0.029
hydin
0.096
prss59.2
-0.029
XLOC-026228
0.094
rpl37
-0.028
gfra2b
0.092
rps29
-0.028
ppp1r42
0.092
rps24
-0.028
XLOC-026578
0.091
rpl22
-0.028
tbata
0.091
lgals1l1
-0.028
CR759887.3
0.091
mylpfa
-0.028
pih1d2
0.091
col28a2a
-0.027
LOC110438323
0.091
XLOC-005350
-0.027
tmem150c
0.090
serpinh2
-0.027
si:dkey-261o4.8
0.090
apoa2
-0.026
slc5a5
0.089
entpd3
-0.026
has1
0.089
cisd1
-0.026
lhx2a
0.089
rbp4
-0.026
tnni4a
0.089
si:dkey-16p21.8
-0.025
cfap58
0.088
tnnc1b
-0.025
CR847936.10
0.088
wnt7aa
-0.025
spata18
0.088
zdhhc3a
-0.025
sh3bp2
0.087
hbbe1.1
-0.025
cby1
0.087
pdgfaa
-0.025
LOC103909937
0.087
cyt1l
-0.025