Daniocell
mapk8ip1a (endoderm)
mitogen-activated protein kinase 8 interacting protein 1a
ZFIN
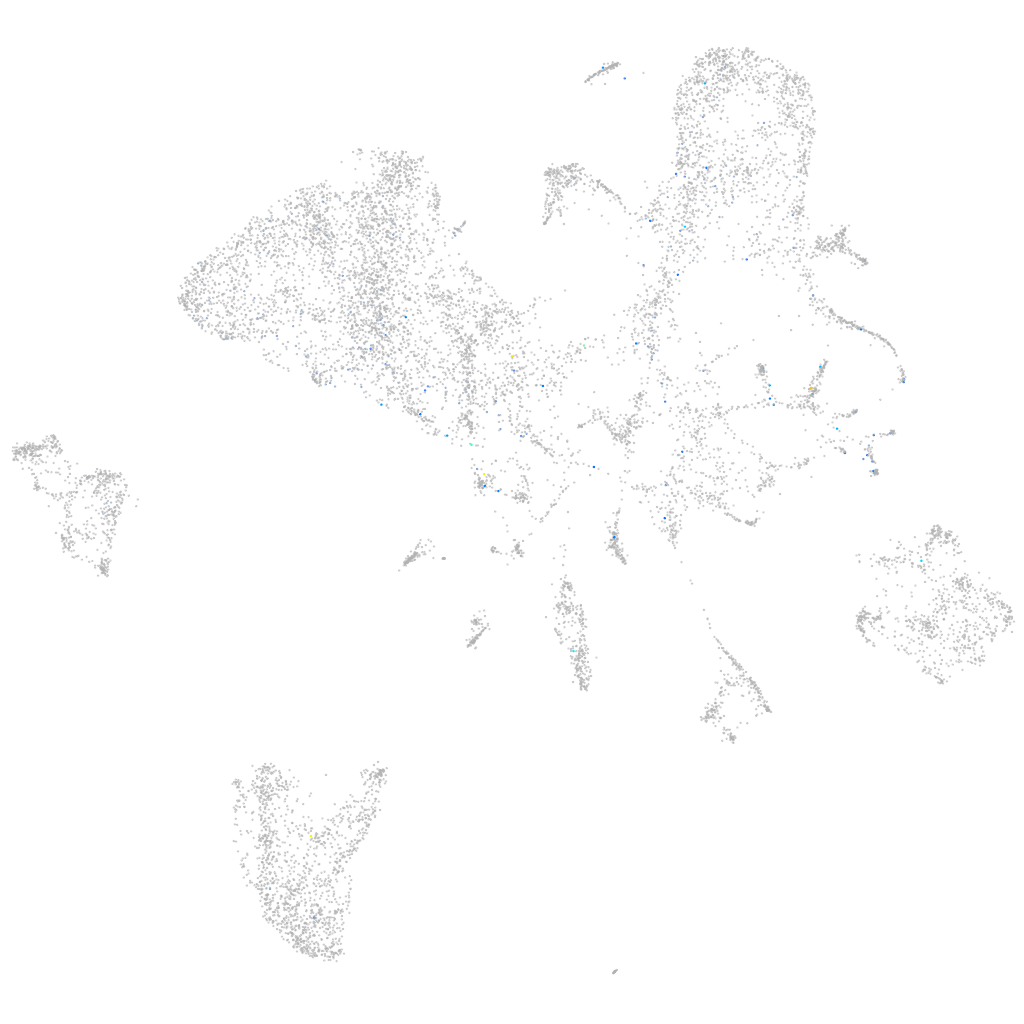
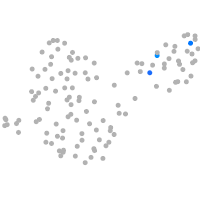
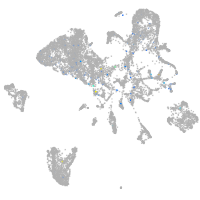
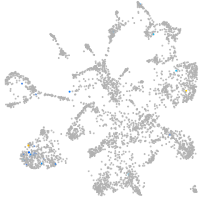
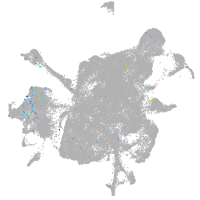
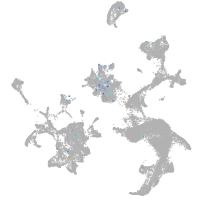
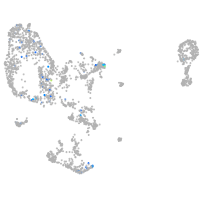
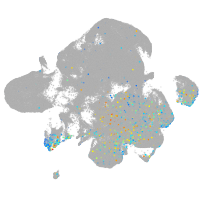
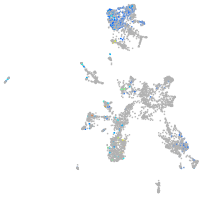
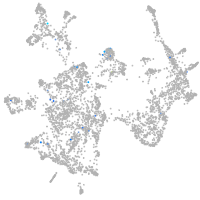
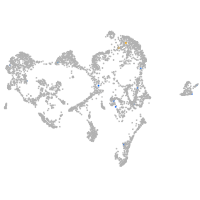
Gene expression UMAP
Display:
Expression
Stage
Other cell groups
all cells
blastomeres
PGCs
endoderm
axial mesoderm
muscle
mural cells /
non-skeletal muscle
mesenchyme
hematopoietic /
vasculature
pronephros
neural
spinal cord / glia
eye
taste / olfactory
otic / lateral line
epidermis
periderm
fin
ionocytes / mucous
pigment cells
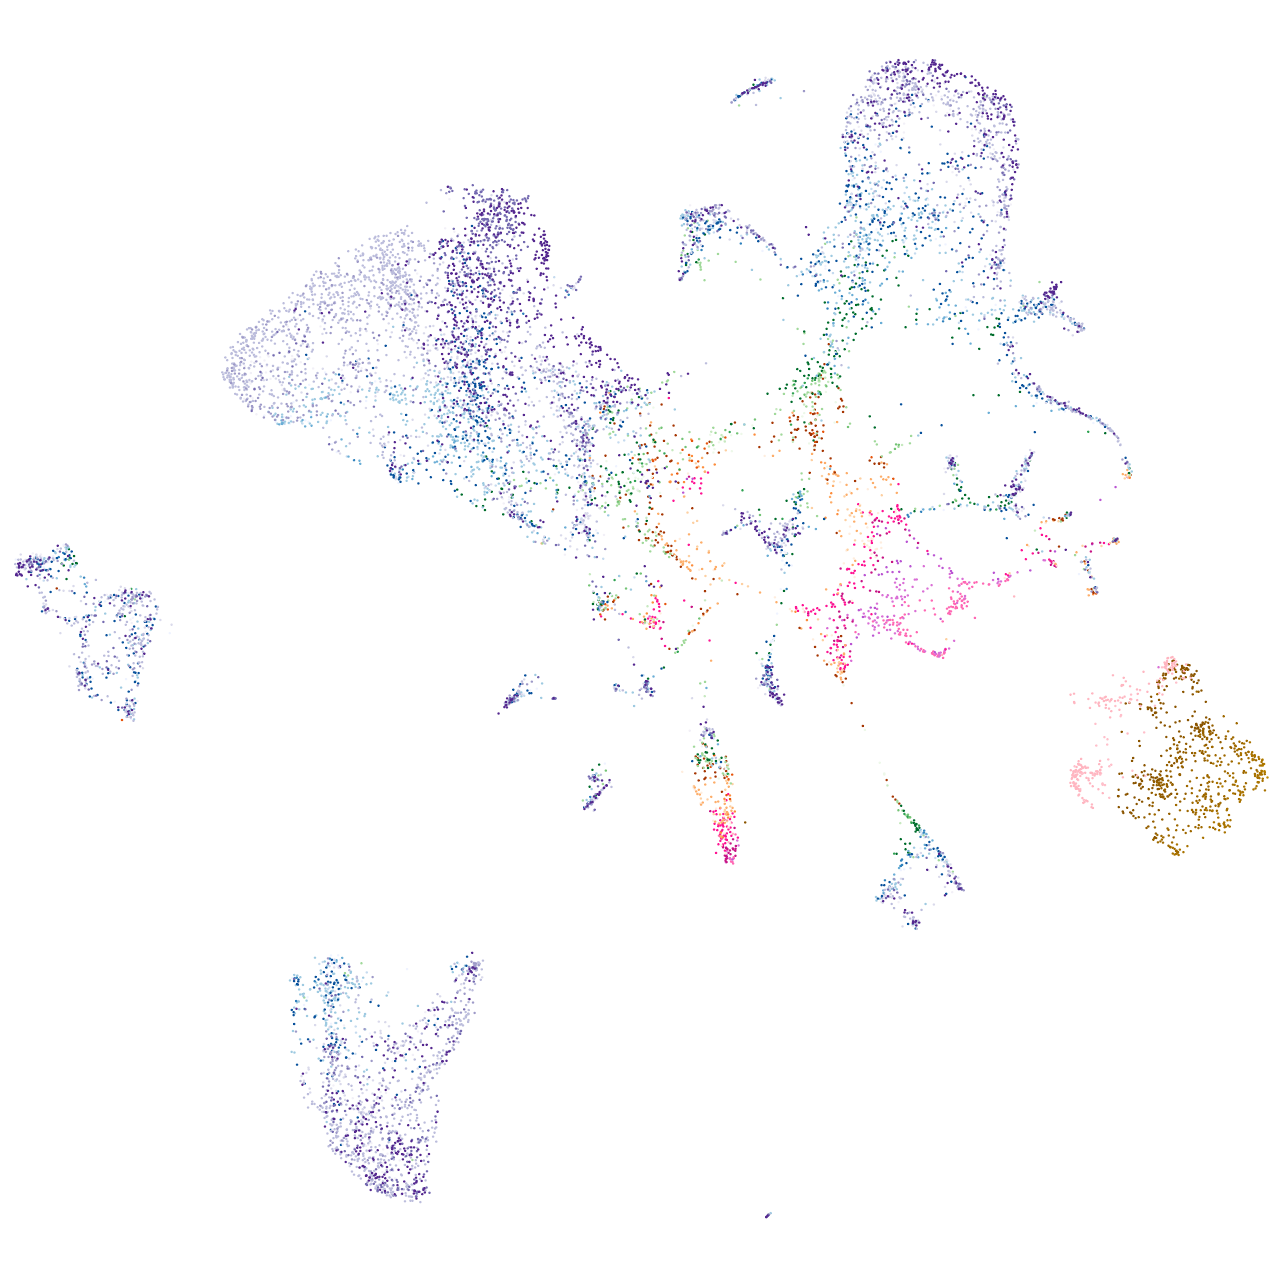
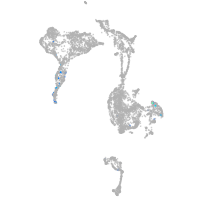
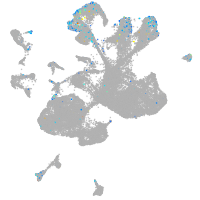
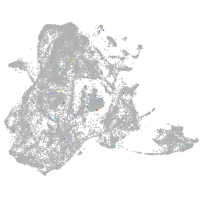
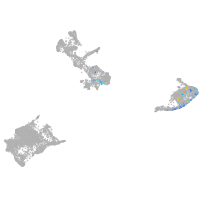
Expression by stage/cluster
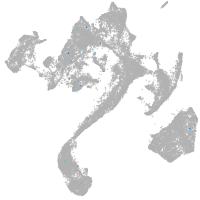
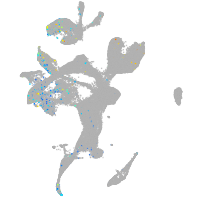
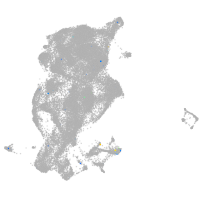
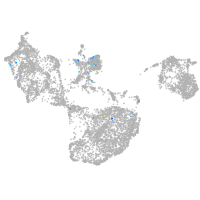
Correlated gene expression
Positive correlation
Negative correlation
Gene
r
Gene
r
PLPP7 (1 of many)
0.228
eif4ebp3
-0.036
LOC110439360
0.220
zgc:92744
-0.033
zgc:91999
0.218
prss1
-0.032
bcan
0.207
amy2a
-0.032
si:dkey-27m7.4
0.204
apoeb
-0.032
kcnh2a
0.180
cgref1
-0.032
LOC101885859
0.166
pnp4b
-0.031
LOC108183436
0.165
tdh
-0.031
LOC110439710
0.165
ctrl
-0.031
CR361551.1
0.154
ctrb1
-0.030
znf1090
0.154
chac1
-0.030
prickle2a
0.144
endou
-0.030
fam43b
0.140
zgc:136461
-0.030
rilpl1
0.139
tmed6
-0.030
HTR7
0.138
cyp2ad2
-0.029
tppp2
0.133
si:ch211-195b11.3
-0.029
lim2.5
0.129
fep15
-0.029
neurod6a
0.128
si:ch211-255i20.3
-0.029
cdkl5
0.128
ela3l
-0.029
CT583626.1
0.127
stm
-0.029
BX571954.1
0.127
CELA1 (1 of many)
-0.029
CR786576.1
0.127
cpb1
-0.029
CU062487.1
0.127
cel.2
-0.028
LOC103910633
0.127
ela2
-0.028
LOC108180010
0.127
cpa5
-0.028
prl2
0.127
zgc:112160
-0.028
si:dkey-245f22.3
0.127
ela2l
-0.028
taar18d
0.127
cel.1
-0.028
XLOC-041356
0.127
prss59.1
-0.028
zgc:112965
0.127
si:dkey-14d8.6
-0.028
si:dkeyp-85h7.1
0.127
ucp2
-0.027
tmtops3a
0.126
cebpd
-0.027
si:ch211-223m11.2
0.126
dap1b
-0.027
si:ch211-191j22.7
0.126
BX908782.1
-0.027
LOC110439505
0.126
pck1
-0.027