Daniocell
map3k7cl (pronephros)
map3k7 C-terminal like
ZFIN
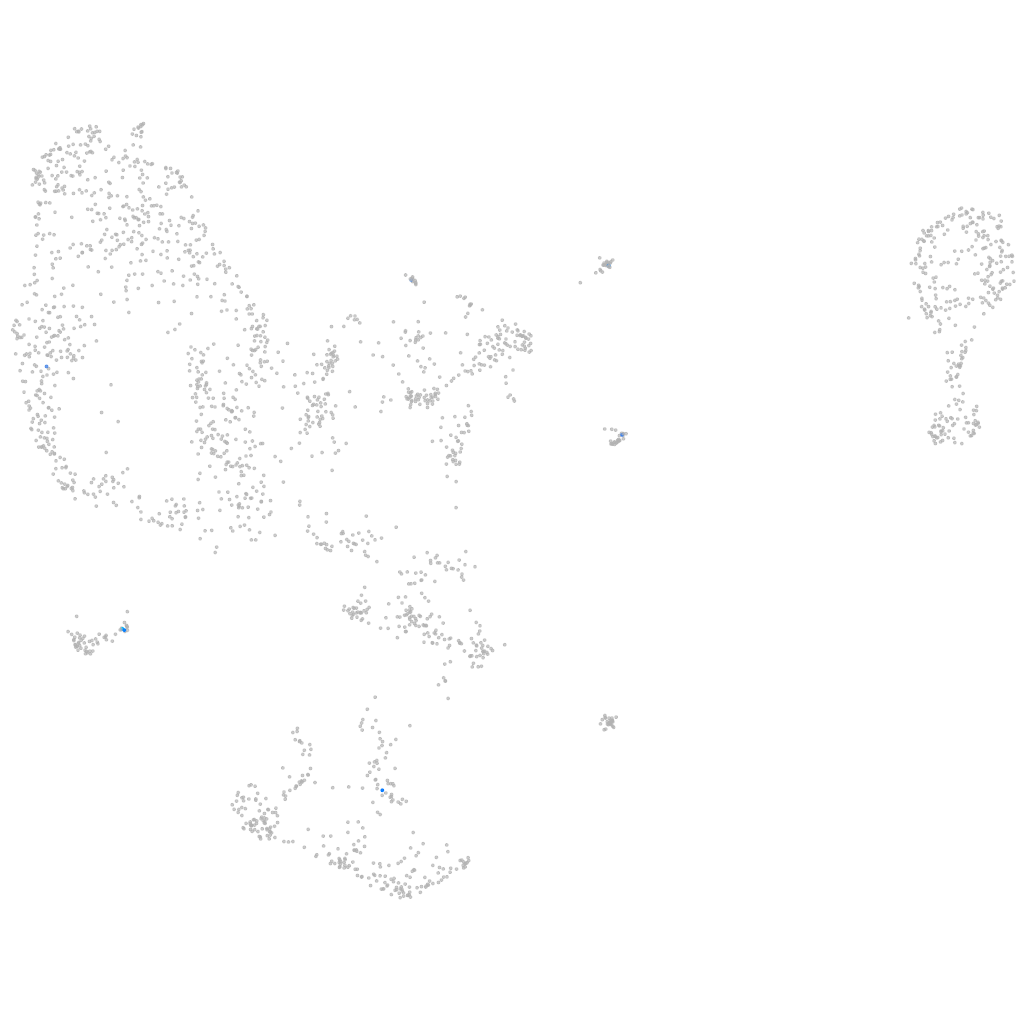
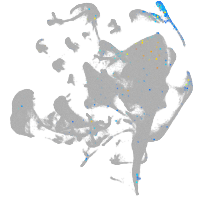
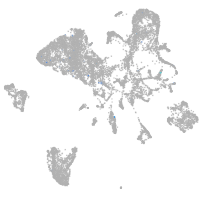
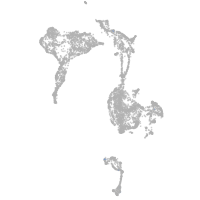
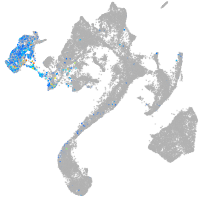
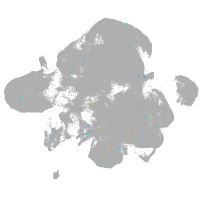
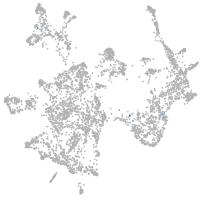
Gene expression UMAP
Display:
Expression
Stage
Other cell groups
all cells
blastomeres
PGCs
endoderm
axial mesoderm
muscle
mural cells /
non-skeletal muscle
mesenchyme
hematopoietic /
vasculature
pronephros
neural
spinal cord / glia
eye
taste / olfactory
otic / lateral line
epidermis
periderm
fin
ionocytes / mucous
pigment cells
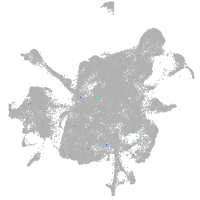
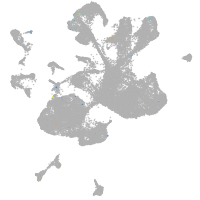
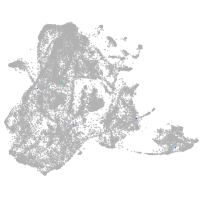
Expression by stage/cluster
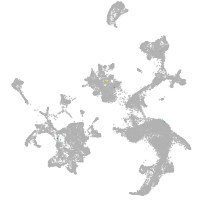
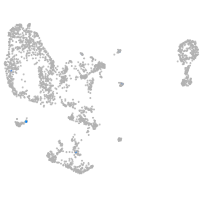
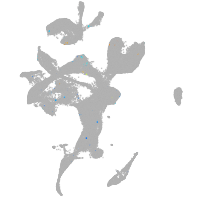
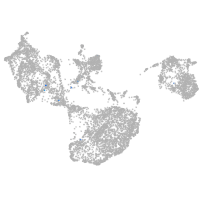
Correlated gene expression
Positive correlation
Negative correlation
Gene
r
Gene
r
LOC101884089
0.610
hspe1
-0.046
mtnr1bb
0.568
cbx5
-0.044
kcnj12b
0.520
vamp3
-0.043
magi3b
0.494
add3a
-0.043
cdh24a
0.419
nucks1a
-0.042
AL845295.2
0.414
rbm47
-0.041
XLOC-007300
0.401
hmgb2a
-0.040
LOC103910835
0.401
hp1bp3
-0.040
si:ch73-313l22.2
0.401
hmgb1b
-0.039
CU633857.1
0.384
hmgn7
-0.039
alpk3b
0.379
tomm6
-0.039
CR932999.1
0.379
si:ch73-1a9.3
-0.038
slc6a6a
0.377
dab2
-0.038
baalca
0.375
ankrd11
-0.038
nxph4
0.367
hnf1bb
-0.038
si:ch73-248e21.5
0.366
mrpl45
-0.038
itgb1b.2
0.351
si:zfos-1192g2.3
-0.037
CACNA2D3 (1 of many)
0.347
ube2l3a
-0.037
LOC564237
0.337
mrpl37
-0.037
mpeg1.2
0.329
lsm4
-0.036
myadml2
0.319
adka
-0.036
XLOC-031182
0.318
pdzk1
-0.036
si:ch211-271d10.2
0.317
akirin1
-0.036
XLOC-044303
0.311
ppid
-0.036
TMEM200C
0.297
cnbpa
-0.036
si:ch211-236g6.1
0.297
nrp1a
-0.036
LOC101885577
0.291
ewsr1a
-0.036
pstpip1a
0.290
rpl22l1
-0.035
c1ql4b
0.289
aqp8b
-0.035
cx32.2
0.284
pfdn1
-0.035
si:ch211-282j17.13
0.282
ppp6r3
-0.035
foxn4
0.277
banf1
-0.035
LOC103908995
0.274
ctsla
-0.035
BX571954.3
0.273
brd3b
-0.035
mpx
0.268
ndufs3
-0.035