Daniocell
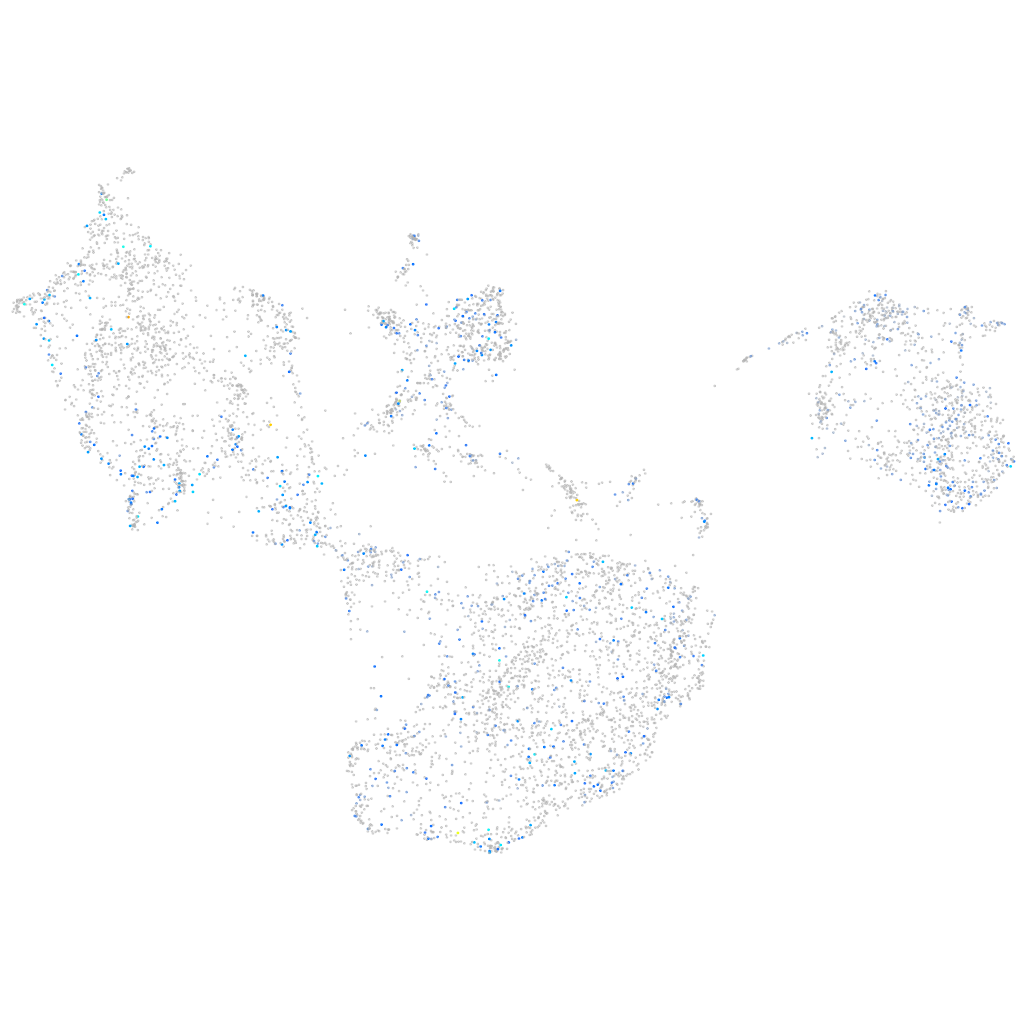
map3k4 (fin)
mitogen-activated protein kinase kinase kinase 4
ZFIN
Gene expression UMAP
Display:
Expression
Stage
Other cell groups
all cells
blastomeres
PGCs
endoderm
axial mesoderm
muscle
mural cells /
non-skeletal muscle
mesenchyme
hematopoietic /
vasculature
pronephros
neural
spinal cord / glia
eye
taste / olfactory
otic / lateral line
epidermis
periderm
fin
ionocytes / mucous
pigment cells
Expression by stage/cluster
Correlated gene expression
Positive correlation
Negative correlation
Gene
r
Gene
r
si:dkey-49n23.3
0.149
CABZ01092746.1
-0.058
slc8a2a
0.131
ecrg4a
-0.053
eloal
0.126
qdpra
-0.040
znf1108
0.122
pah
-0.038
zgc:112146
0.115
ucp1
-0.036
LOC110438044
0.110
serpinf1
-0.036
XLOC-009121
0.108
asip2b
-0.035
sspn
0.108
rpl39
-0.035
si:ch211-214b16.3
0.105
and2
-0.033
XLOC-008804
0.098
pcbd1
-0.033
nt5c1aa
0.096
tat
-0.030
XLOC-044090
0.095
cdo1
-0.030
vac14
0.089
pabpc4
-0.029
si:ch211-214j8.1
0.089
rbp4
-0.029
si:ch211-134a4.6
0.085
angptl6
-0.028
XLOC-007709
0.084
pabpc1b
-0.027
XLOC-006319
0.083
zgc:77439
-0.027
znf1030
0.083
pnpla3
-0.027
map3k19
0.083
akt2l
-0.027
LOC110440123
0.082
prss59.2
-0.026
XLOC-002869
0.082
ptger1b
-0.026
LOC110440222
0.082
hpdb
-0.026
dcst2
0.082
tnmd
-0.026
si:dkey-217f16.5
0.082
ttn.2
-0.026
LOC101883670
0.080
caspa
-0.026
XLOC-032803
0.079
mylpfa
-0.026
ptrh1
0.079
fgfbp2a
-0.025
si:ch211-51e12.7
0.079
ogna
-0.025
LOC103911261
0.077
ptx3a
-0.025
diras2
0.077
si:dkeyp-51f12.2
-0.025
MGAT5B
0.077
casp9
-0.025
LOC108183452
0.077
lpgat1
-0.025
CR354372.1
0.077
abi2a
-0.024
hmga1a
0.077
srd5a2a
-0.024
hbl2
0.077
si:dkey-3h3.3
-0.024