Daniocell
macf1a (blastomeres)
microtubule actin crosslinking factor 1a
ZFIN
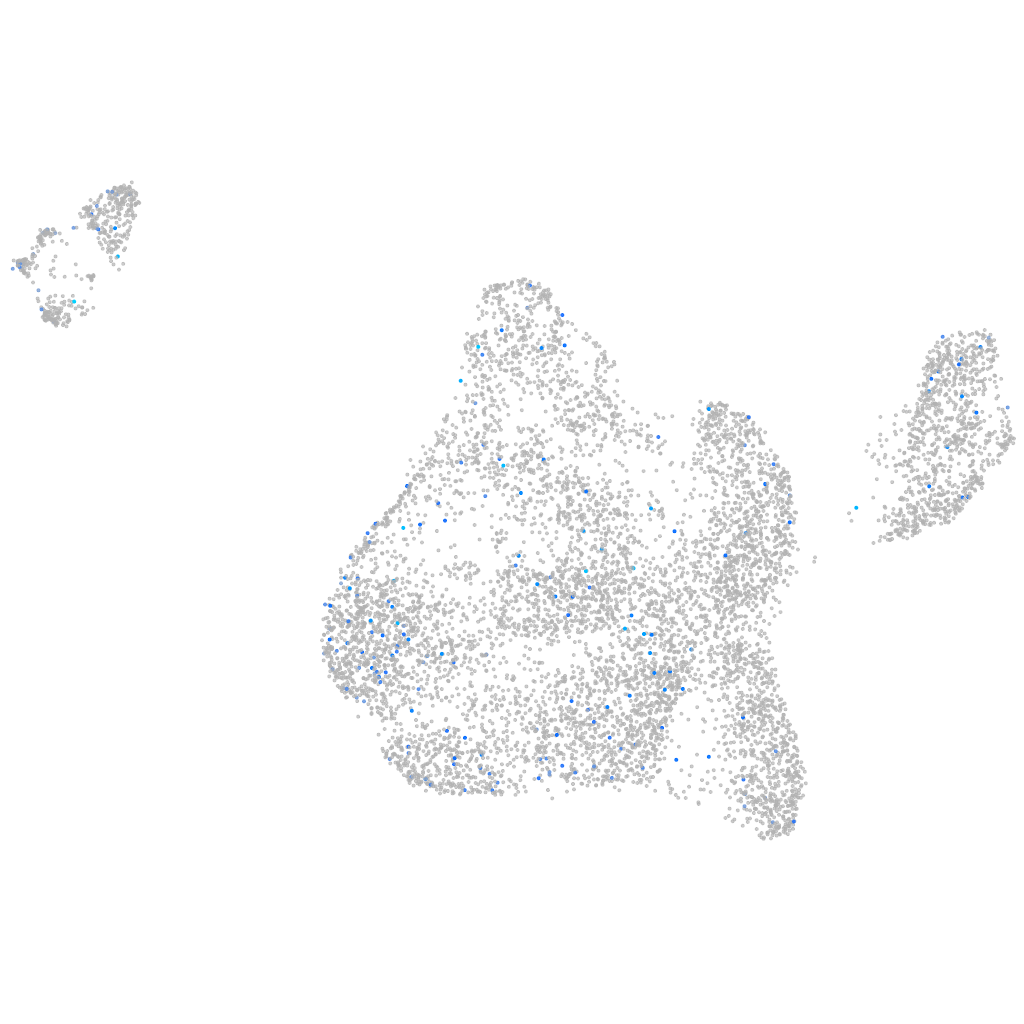
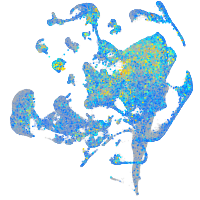
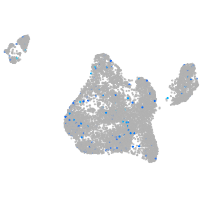
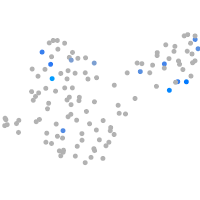
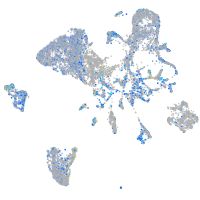
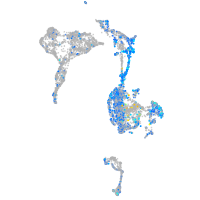
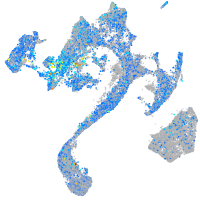
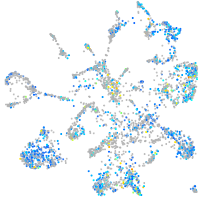
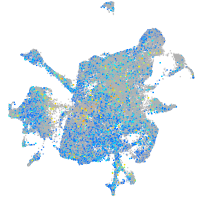
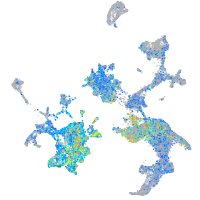
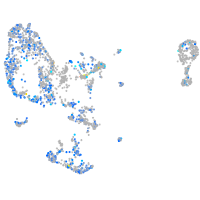
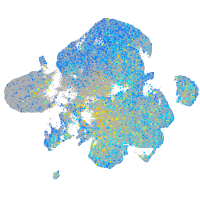
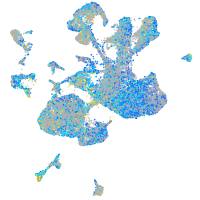
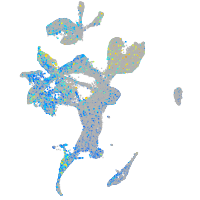
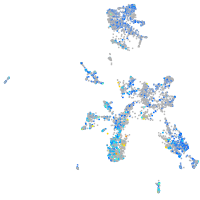
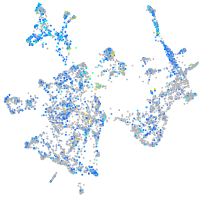
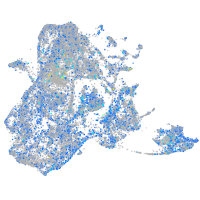
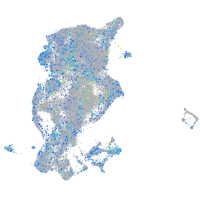
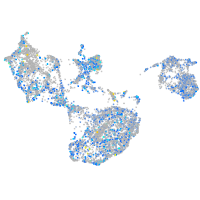
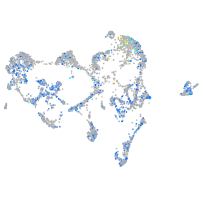
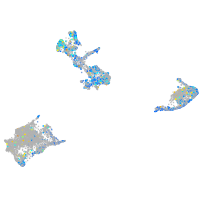
Gene expression UMAP
Display:
Expression
Stage
Other cell groups
all cells
blastomeres
PGCs
endoderm
axial mesoderm
muscle
mural cells /
non-skeletal muscle
mesenchyme
hematopoietic /
vasculature
pronephros
neural
spinal cord / glia
eye
taste / olfactory
otic / lateral line
epidermis
periderm
fin
ionocytes / mucous
pigment cells
Expression by stage/cluster
Correlated gene expression
Positive correlation
Negative correlation
Gene
r
Gene
r
LOC110438331
0.143
NC-002333.4
-0.045
ugt5c2
0.126
zgc:110425
-0.035
XLOC-022251
0.119
si:dkey-108k21.10
-0.032
CU914164.1
0.106
cdc42l
-0.030
CR753874.1
0.104
akap12b
-0.029
tmem229a
0.100
tfap4
-0.028
frmpd1b
0.097
ptk7a
-0.028
si:ch211-196h16.12
0.096
zgc:56525
-0.028
FP243383.1
0.091
tp53
-0.027
INHBC
0.091
ddost
-0.027
LOC103910903
0.090
gadd45ba
-0.027
LOC101886407
0.089
rhoca
-0.027
efna2b
0.088
zgc:153405
-0.026
hhla2a.2
0.084
rb1
-0.026
CR759836.1
0.084
si:ch1073-153i20.5
-0.025
CR626887.3
0.083
fbxw8
-0.025
gpr156
0.082
zgc:154064
-0.025
crtc1a
0.082
zgc:114118
-0.025
XLOC-005350
0.081
wdr1
-0.024
LOC101885981
0.080
cldn12
-0.024
LO018493.2
0.078
XLOC-031067
-0.024
si:dkey-32n7.7
0.077
si:ch211-113a14.18
-0.024
XLOC-004335
0.077
LOC103911361
-0.024
cyp26c1
0.076
ufd1l
-0.024
casp6l2
0.076
galm
-0.024
gpr185b
0.076
stx6
-0.024
LOC110438475
0.073
pou5f3
-0.024
CR376741.1
0.073
slc25a32a
-0.023
adora2b
0.072
eif4ebp3l
-0.023
si:dkey-16l2.20
0.071
zgc:153993
-0.023
nfixb
0.071
si:ch211-286b5.4
-0.023
FP103106.1
0.071
ube4b
-0.023
fryb
0.070
ppp1r26
-0.023
c15h3orf80
0.070
higd2a
-0.023
arhgap39
0.070
eloa
-0.022