Daniocell
lrrc75ba (blastomeres)
leucine rich repeat containing 75Ba
ZFIN
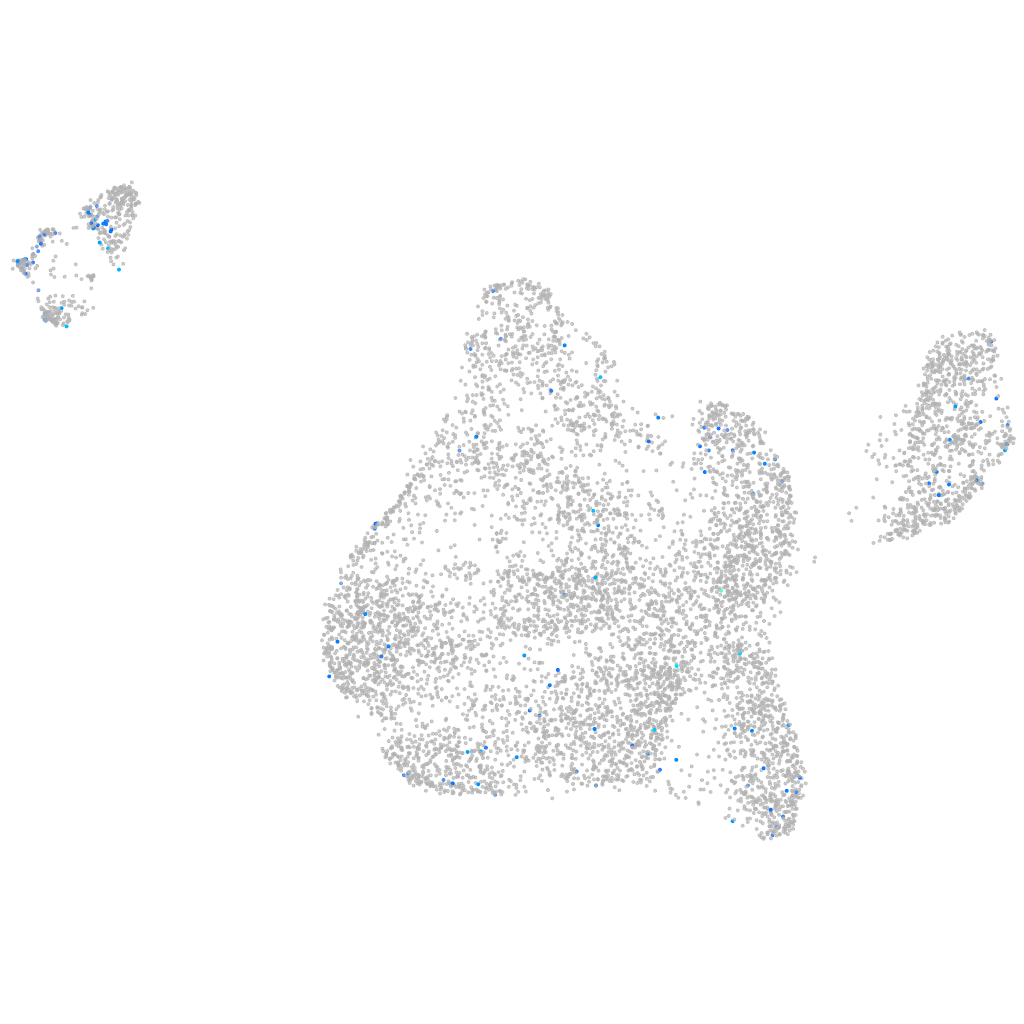
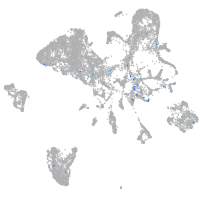
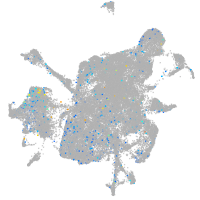
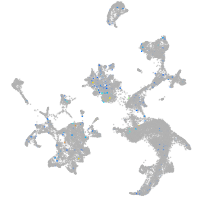
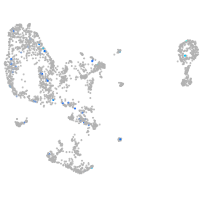
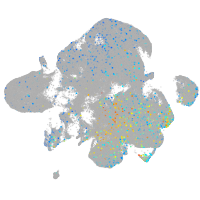
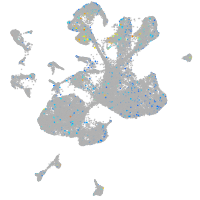
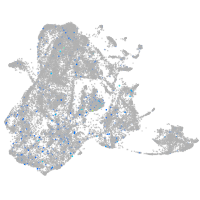
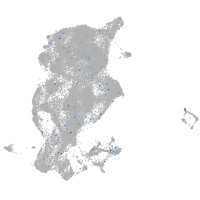
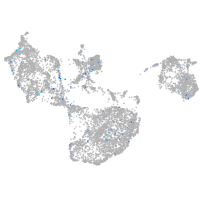
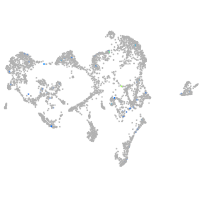
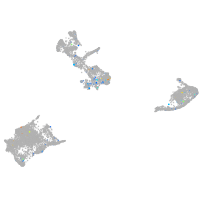
Gene expression UMAP
Display:
Expression
Stage
Other cell groups
all cells
blastomeres
PGCs
endoderm
axial mesoderm
muscle
mural cells /
non-skeletal muscle
mesenchyme
hematopoietic /
vasculature
pronephros
neural
spinal cord / glia
eye
taste / olfactory
otic / lateral line
epidermis
periderm
fin
ionocytes / mucous
pigment cells
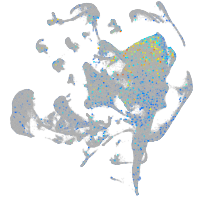
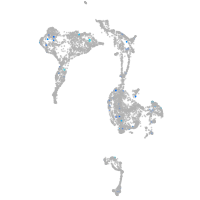
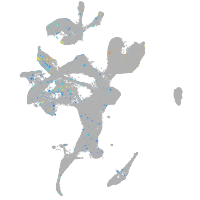
Expression by stage/cluster
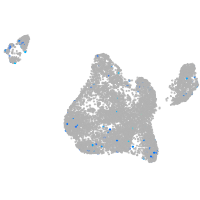
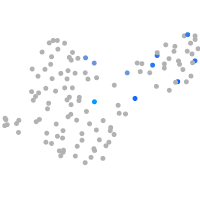
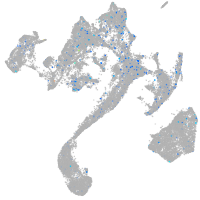
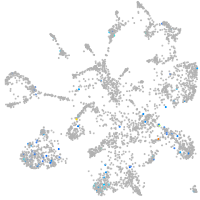
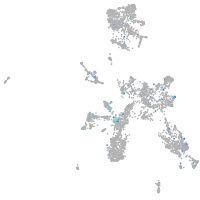
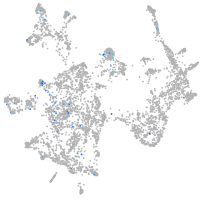
Correlated gene expression
Positive correlation
Negative correlation
Gene
r
Gene
r
LOC110439789
0.160
marcksl1b
-0.108
CCR8
0.156
hspb1
-0.101
LOC797394
0.144
hnrnpa0b
-0.098
def6c
0.137
stm
-0.095
taar20w
0.136
hmga1a
-0.094
si:ch73-281i18.7
0.135
hmgn6
-0.090
LO017716.1
0.133
si:ch73-1a9.3
-0.088
LOC103909575
0.131
khdrbs1a
-0.083
agtr1b
0.130
cirbpb
-0.080
fgf20a
0.127
si:ch211-152c2.3
-0.079
LO018605.2
0.121
si:ch211-222l21.1
-0.079
BX072559.1
0.117
si:dkey-151g10.6
-0.076
c3a.2
0.113
eef1a1l1
-0.075
zmp:0000001316
0.112
dynll1
-0.075
ccdc50
0.110
ptmab
-0.074
XLOC-035162
0.109
cox7c
-0.074
LOC101885706
0.106
polr3gla
-0.074
gnrhr2
0.106
rps4x
-0.074
LOC110438108
0.106
aldob
-0.073
CU972454.5
0.106
snrpd1
-0.072
XLOC-031033
0.106
hmgb2a
-0.070
acp5a
0.105
rps21
-0.069
pip5k1ba
0.104
si:ch73-281n10.2
-0.069
BX294661.2
0.104
rps19
-0.068
CABZ01044048.1
0.104
rpl26
-0.068
tgfa
0.104
ybx1
-0.068
LOC101883154
0.103
rpl36
-0.068
nmu
0.102
rplp1
-0.067
XLOC-038343
0.102
rps15
-0.066
FO834825.1
0.102
rps12
-0.065
cryba4
0.100
rps6
-0.065
LOC100538336
0.100
rplp0
-0.062
mknk2a
0.099
rpl10
-0.062
fbxo32
0.099
si:dkey-56m19.5
-0.060
LOC108184024
0.098
rps20
-0.060