Daniocell
lrp10 (mural cells / non-skeletal muscle)
low density lipoprotein receptor-related protein 10
ZFIN
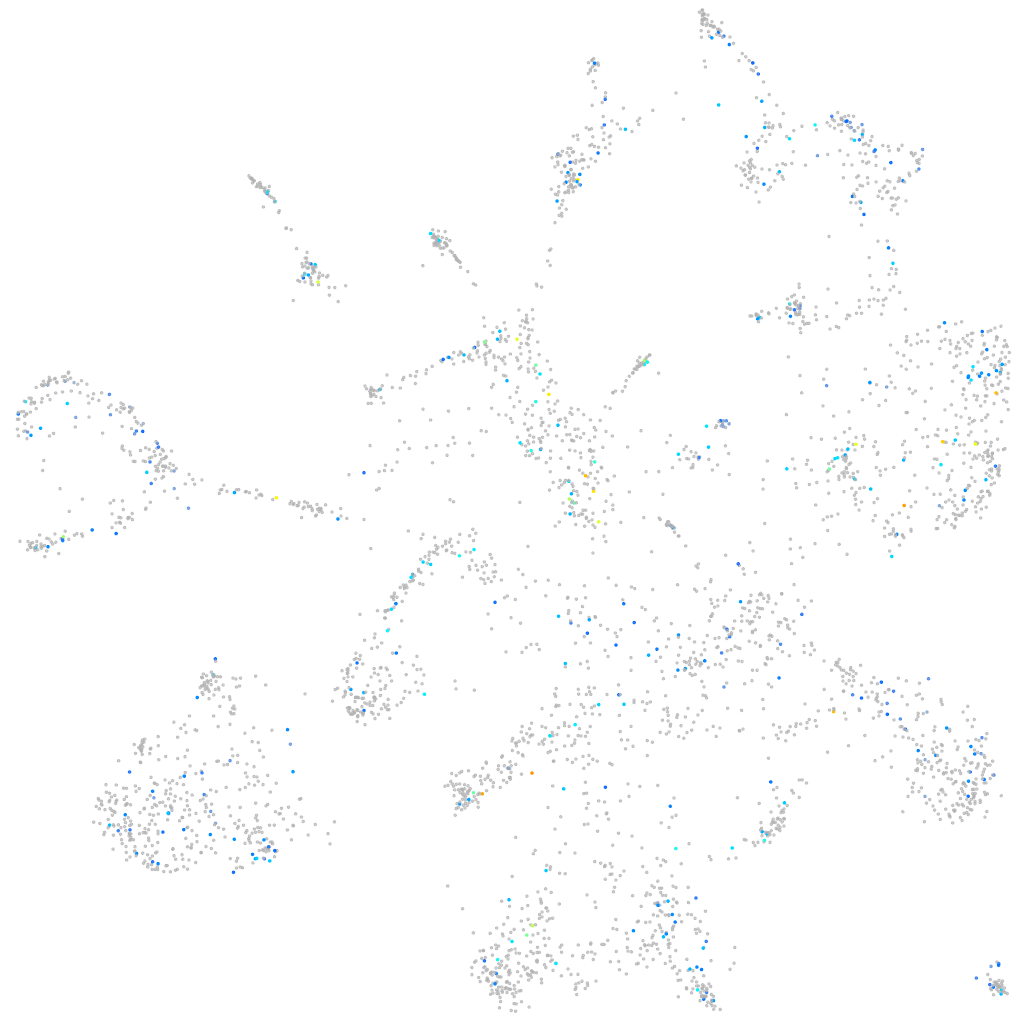
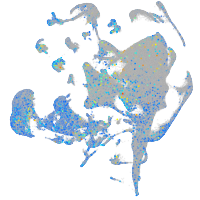
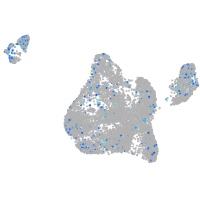
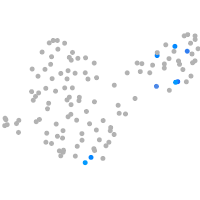
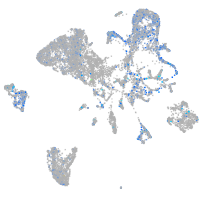
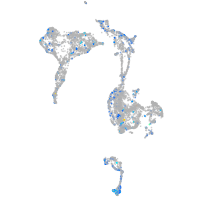
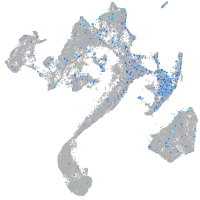
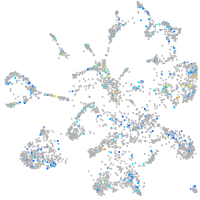
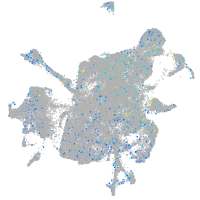
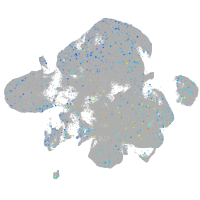
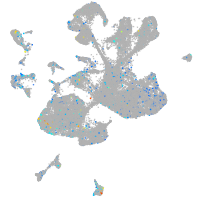
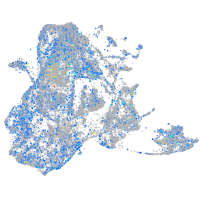
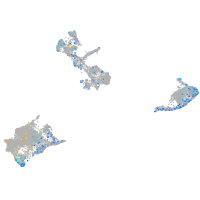
Gene expression UMAP
Display:
Expression
Stage
Other cell groups
all cells
blastomeres
PGCs
endoderm
axial mesoderm
muscle
mural cells /
non-skeletal muscle
mesenchyme
hematopoietic /
vasculature
pronephros
neural
spinal cord / glia
eye
taste / olfactory
otic / lateral line
epidermis
periderm
fin
ionocytes / mucous
pigment cells
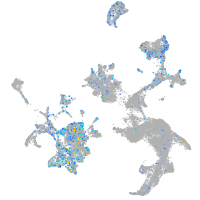
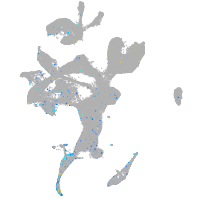
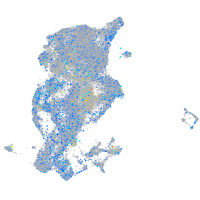
Expression by stage/cluster
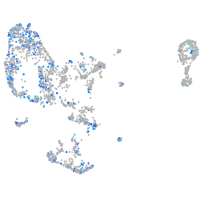
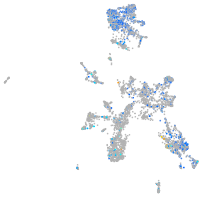
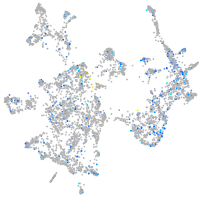
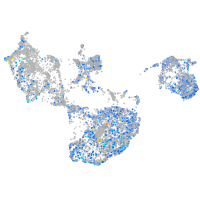
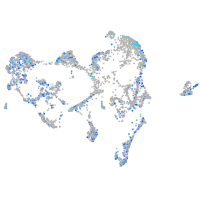
Correlated gene expression
Positive correlation
Negative correlation
Gene
r
Gene
r
si:dkey-96l17.6
0.127
rps12
-0.071
fam155b
0.120
rplp1
-0.066
tagapb
0.114
rps23
-0.061
si:ch211-222n22.1
0.111
rps29
-0.060
LOC110440062
0.110
si:dkey-151g10.6
-0.057
XLOC-031033
0.109
rps21
-0.052
si:ch211-250k18.7
0.107
rpl14
-0.051
si:dkey-234i14.3
0.103
nucks1a
-0.050
fbxo40.1
0.102
rpl32
-0.050
odam
0.102
rps13
-0.050
rab11a
0.097
rpl18a
-0.049
CR925728.2
0.095
rpl24
-0.046
si:dkey-88l16.3
0.094
rpl37
-0.045
cyp2aa1
0.092
rps28
-0.043
XLOC-008601
0.091
rps25
-0.043
kidins220a
0.091
cct5
-0.043
scpp9
0.090
rpl39
-0.043
si:ch211-170d8.2
0.090
acta2
-0.042
notch3
0.090
sumo2b
-0.042
cd248a
0.088
rplp2l
-0.042
LOC110439422
0.087
fam133b
-0.041
slc4a3
0.087
htatsf1
-0.041
hey2
0.086
rpl36
-0.041
si:ch73-226i7.1
0.086
pacsin1a
-0.041
ell
0.086
rad21a
-0.041
si:ch211-129c21.1
0.085
ankhd1
-0.040
SFMBT1
0.084
hmgb3a
-0.040
rasl12
0.083
znf598
-0.040
CU929145.2
0.083
RSBN1
-0.039
sdcbp2
0.083
cfl1
-0.039
ubald2
0.083
tbca
-0.038
LOC100333163
0.083
rps8a
-0.038
XLOC-042319
0.081
plekha5
-0.038
soul5
0.081
rtf1
-0.038
LOC110438454
0.080
rps10
-0.038