Daniocell
lrmp (taste / olfactory)
lymphoid-restricted membrane protein
ZFIN
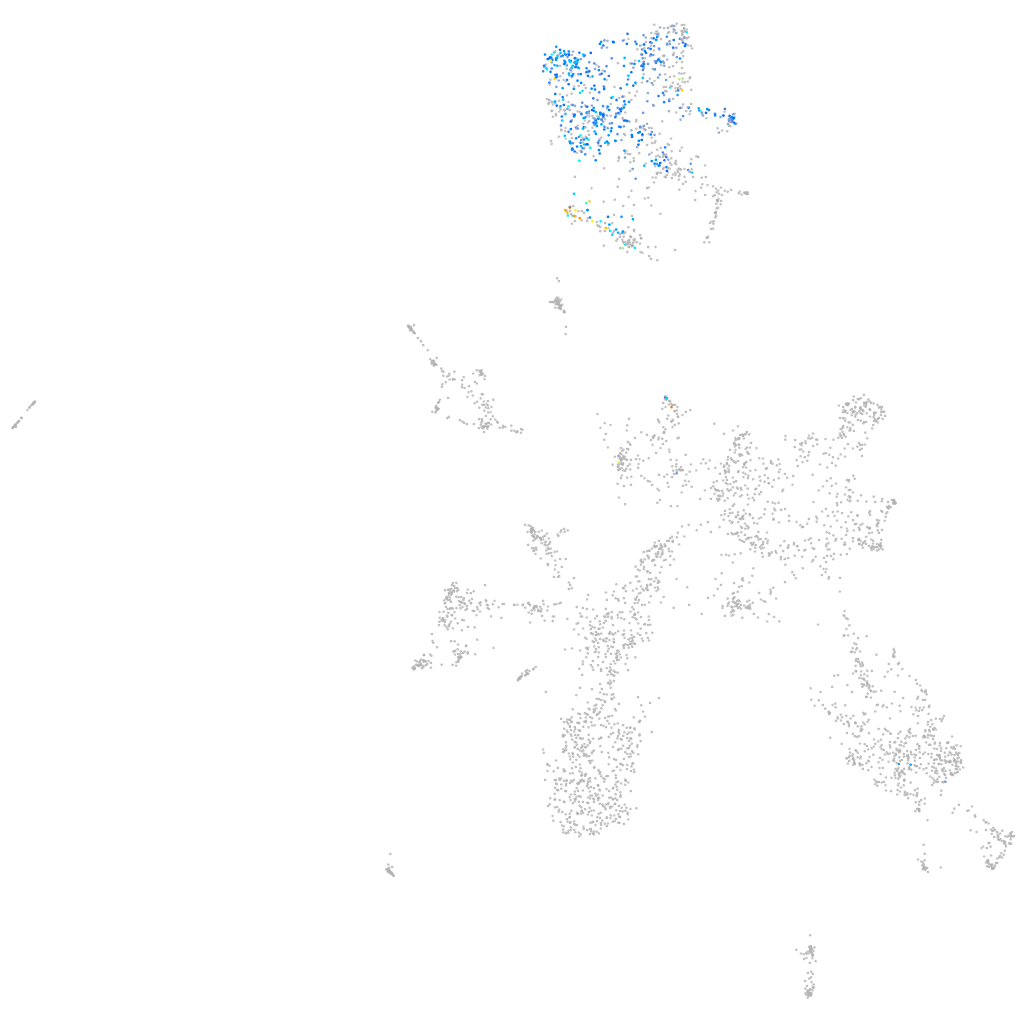
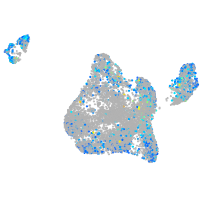
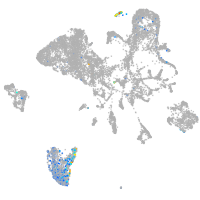
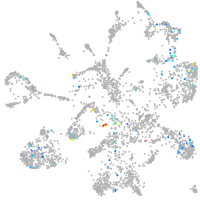
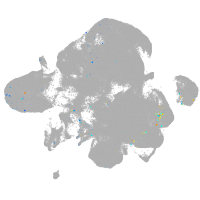
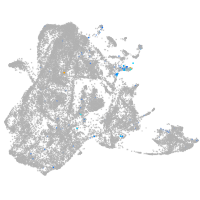
Gene expression UMAP
Display:
Expression
Stage
Other cell groups
all cells
blastomeres
PGCs
endoderm
axial mesoderm
muscle
mural cells /
non-skeletal muscle
mesenchyme
hematopoietic /
vasculature
pronephros
neural
spinal cord / glia
eye
taste / olfactory
otic / lateral line
epidermis
periderm
fin
ionocytes / mucous
pigment cells
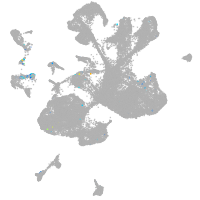
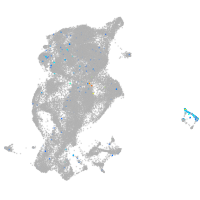
Expression by stage/cluster
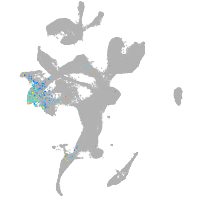
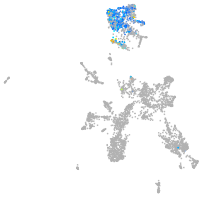
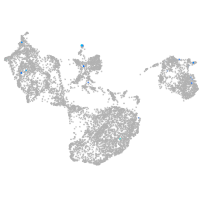
Correlated gene expression
Positive correlation
Negative correlation
Gene
r
Gene
r
rgs1
0.677
elavl3
-0.289
gng13a
0.652
tmsb
-0.251
gnb3a
0.646
stmn1b
-0.249
myl9a
0.643
si:ch211-153b23.5
-0.241
itpkb
0.636
pvalb5
-0.240
avil
0.635
tspan2a
-0.240
trpm5
0.622
adcyap1b
-0.230
LOC100536671
0.622
zgc:55461
-0.229
kcnk17
0.603
rtn1a
-0.229
si:dkeyp-80c12.5
0.600
insm1a
-0.227
CR318588.3
0.591
si:dkeyp-75h12.5
-0.227
CABZ01072157.1
0.586
si:dkey-276j7.1
-0.226
adgrf3b
0.585
vdac3
-0.224
grtp1a
0.581
tuba1a
-0.219
zgc:158412
0.581
LOC100537342
-0.219
si:dkeyp-72h1.1
0.574
atf5a
-0.217
rassf6
0.572
zgc:65894
-0.217
itpr3
0.564
tmeff1b
-0.216
atp2a3
0.563
ebf3a
-0.212
crip1
0.556
scg2b
-0.211
igfbp5a
0.556
gng3
-0.209
zgc:66484
0.554
sncb
-0.206
fam57ba
0.553
chga
-0.205
LOC103909697
0.551
NC-002333.4
-0.205
gna14a
0.548
fstl5
-0.201
si:dkeyp-71f10.5
0.545
nova2
-0.200
pou2f3
0.539
olfm1b
-0.197
pkd1l3
0.522
hsbp1a
-0.196
hopx
0.522
fthl31
-0.195
XLOC-039931
0.520
si:ch211-10a23.2
-0.195
fscn2a
0.518
hmgb1b
-0.194
mvp
0.515
fabp10b
-0.194
FP016247.2
0.515
meig1
-0.192
tmod4
0.513
si:ch211-222l21.1
-0.192
gng10
0.513
gnb1a
-0.190