Daniocell
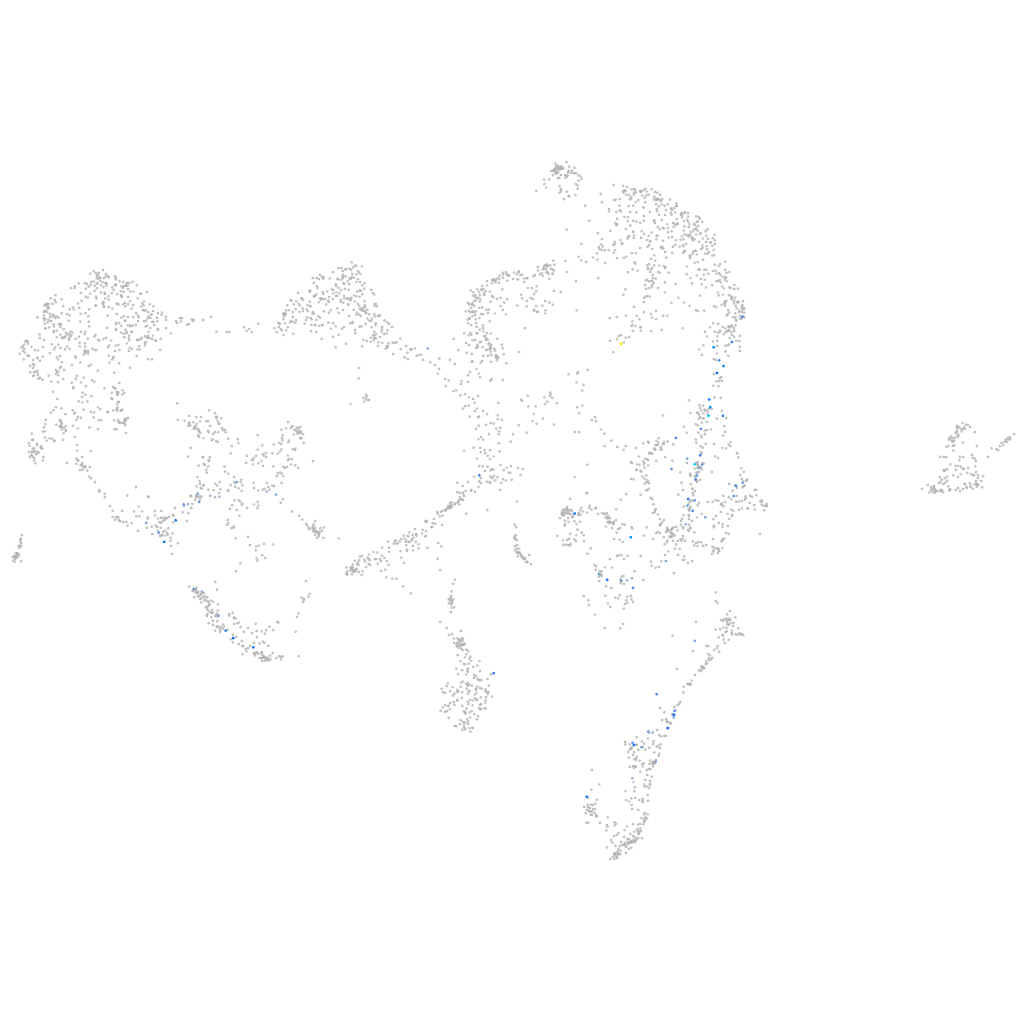
loxl2a (ionocytes / mucous-producing)
lysyl oxidase-like 2a
ZFIN
Gene expression UMAP
Display:
Expression
Stage
Other cell groups
all cells
blastomeres
PGCs
endoderm
axial mesoderm
muscle
mural cells /
non-skeletal muscle
mesenchyme
hematopoietic /
vasculature
pronephros
neural
spinal cord / glia
eye
taste / olfactory
otic / lateral line
epidermis
periderm
fin
ionocytes / mucous
pigment cells
Expression by stage/cluster
Correlated gene expression
Positive correlation
Negative correlation
Gene
r
Gene
r
AL928685.2
0.401
si:dkey-193p11.2
-0.088
klf1
0.353
si:dkey-248g15.3
-0.080
hist1h2a10
0.296
mt-atp6
-0.078
si:dkey-243i1.1
0.287
soul2
-0.072
XLOC-007195
0.285
fabp2
-0.068
si:dkeyp-93d12.1
0.250
higd2a
-0.067
si:ch211-113a14.29
0.240
abcb5
-0.066
ntrk1
0.237
sod1
-0.066
LOC103909515
0.231
prdx5
-0.065
si:dkey-246j6.1
0.208
selenow2b
-0.063
XLOC-028899
0.207
egr1
-0.063
ccdc80l2
0.202
si:dkey-247k7.2
-0.063
XLOC-007006
0.199
tdh
-0.063
mest
0.198
itm2bb
-0.062
zgc:173705
0.198
krt5
-0.061
si:ch211-106h11.3
0.195
ctsla
-0.060
CU179656.2
0.190
si:dkey-184p9.7
-0.060
slco1f1
0.190
enosf1
-0.060
si:dkey-161j23.7
0.186
zgc:110333
-0.059
atad5a
0.181
si:dkey-33i11.4
-0.058
si:ch211-216p19.6
0.176
zgc:162944
-0.058
rtn2a
0.172
ndrg3a
-0.058
myo7bb
0.170
atp1b1b
-0.058
sparcl2
0.167
krt17
-0.058
myo1hb
0.166
echdc2
-0.058
LOC110438394
0.160
prelid3b
-0.057
glipr1b
0.158
DSG2
-0.057
LOC108190362
0.155
si:ch211-79k12.1
-0.057
si:ch211-161n3.3
0.149
ppl
-0.056
si:ch211-155e24.3
0.149
mat2al
-0.056
si:ch211-173m16.2
0.148
atp6v1h
-0.056
bub1
0.148
si:ch211-195b11.3
-0.055
RF00211
0.147
foxi3b
-0.055
cdc42l2
0.146
tuft1a
-0.055
n4bp2l2
0.144
atp1a1a.3
-0.055