Daniocell
llgl2 (taste / olfactory)
LLGL scribble cell polarity complex component 2
ZFIN
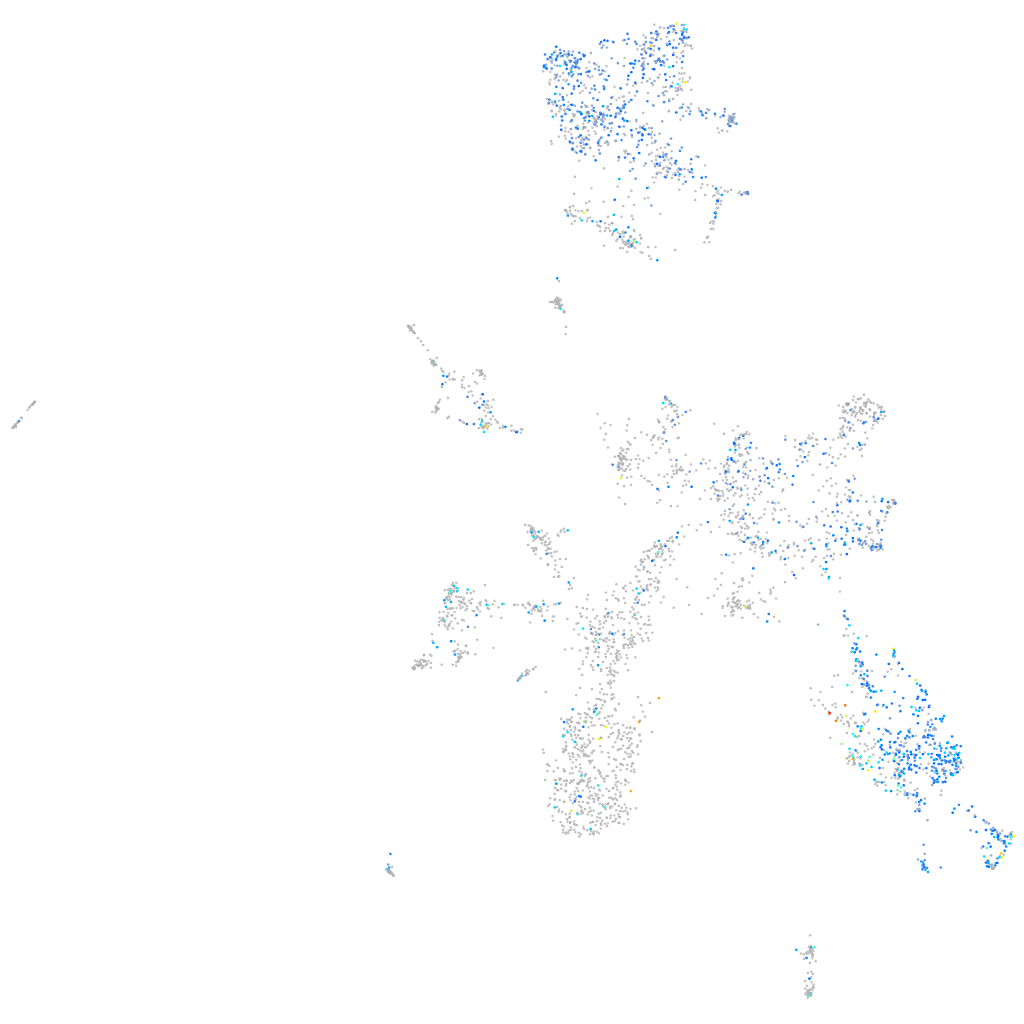
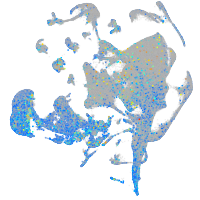
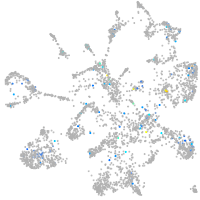
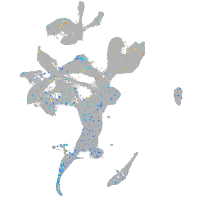
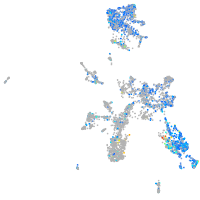
Gene expression UMAP
Display:
Expression
Stage
Other cell groups
all cells
blastomeres
PGCs
endoderm
axial mesoderm
muscle
mural cells /
non-skeletal muscle
mesenchyme
hematopoietic /
vasculature
pronephros
neural
spinal cord / glia
eye
taste / olfactory
otic / lateral line
epidermis
periderm
fin
ionocytes / mucous
pigment cells
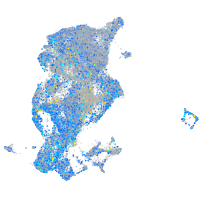
Expression by stage/cluster
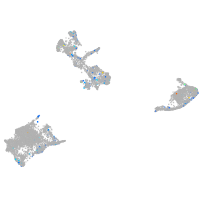
Correlated gene expression
Positive correlation
Negative correlation
Gene
r
Gene
r
malb
0.354
elavl3
-0.133
cldne
0.350
vdac3
-0.128
tmem176l.4
0.330
tmeff1b
-0.118
ftr83
0.318
si:dkey-56m19.5
-0.117
si:dkey-247k7.2
0.316
sox11a
-0.116
LOC799574
0.316
stmn1b
-0.113
cldnb
0.313
nova2
-0.113
krt1-c5
0.311
rtn1a
-0.112
capn8
0.310
hmgb3a
-0.112
moxd1l
0.308
insm1a
-0.108
elf3
0.308
ywhag2
-0.104
muc5e
0.302
epb41a
-0.100
krt8
0.300
hbae3
-0.097
s100a10b
0.292
si:dkey-276j7.1
-0.094
si:ch73-204p21.2
0.292
gnao1a
-0.093
si:ch211-195b11.3
0.291
dync1i1
-0.093
zfp36l1a
0.289
si:ch211-133n4.4
-0.093
wu:fj16a03
0.289
insm1b
-0.092
sult2st3
0.286
ptmab
-0.091
ptprfb
0.283
inab
-0.091
si:ch73-31d8.2
0.282
gap43
-0.090
krt18a.1
0.281
neurod1
-0.090
dnase1l4.1
0.281
hbbe1.3
-0.089
zgc:136892
0.278
zc4h2
-0.089
si:ch211-243g18.2
0.275
ebf2
-0.088
krt18b
0.274
dbn1
-0.088
gsta.1
0.274
hbbe1.1
-0.088
ttc39a
0.272
ptmaa
-0.087
dnmbp
0.272
LOC100537384
-0.087
si:dkey-87o1.2
0.271
atp6v0cb
-0.086
zgc:101785
0.271
elavl4
-0.086
si:dkeyp-86h10.3
0.269
actc1b
-0.085
cers3b
0.269
sncb
-0.082
stm
0.268
cnrip1a
-0.082
b3gnt7
0.268
si:dkey-280e21.3
-0.082