Daniocell
lipt2 (mesenchyme)
lipoyl(octanoyl) transferase 2
ZFIN
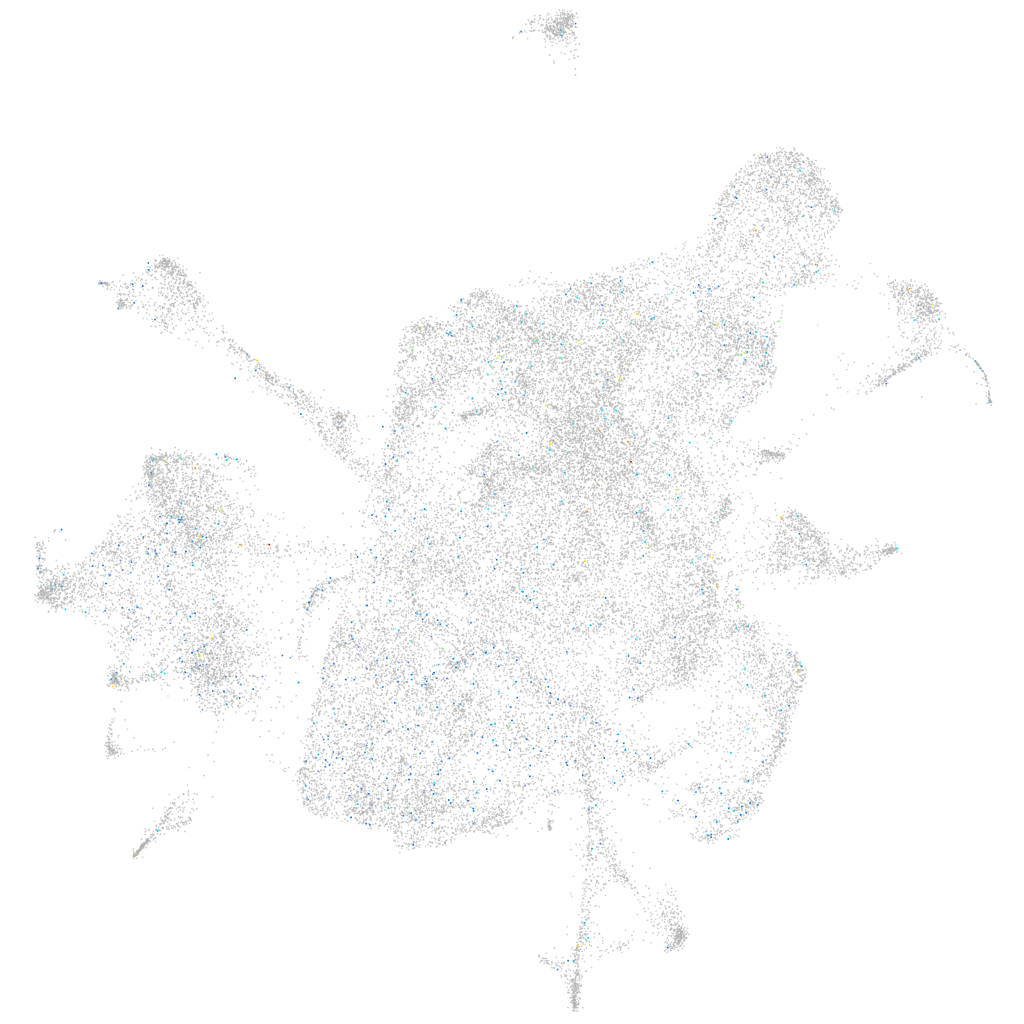
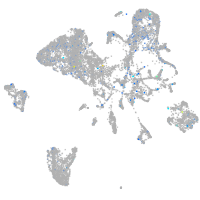
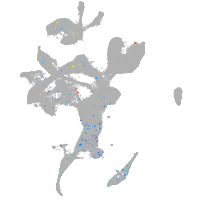
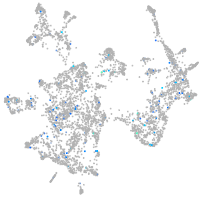
Gene expression UMAP
Display:
Expression
Stage
Other cell groups
all cells
blastomeres
PGCs
endoderm
axial mesoderm
muscle
mural cells /
non-skeletal muscle
mesenchyme
hematopoietic /
vasculature
pronephros
neural
spinal cord / glia
eye
taste / olfactory
otic / lateral line
epidermis
periderm
fin
ionocytes / mucous
pigment cells
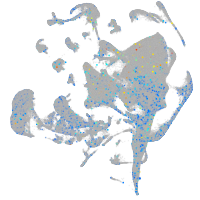
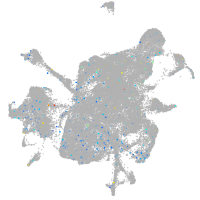
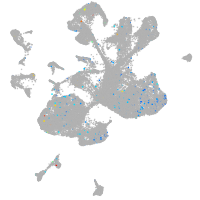
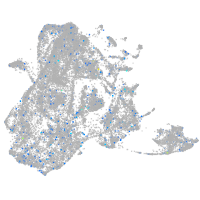
Expression by stage/cluster
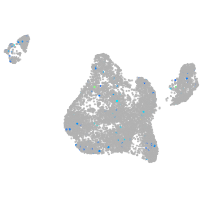
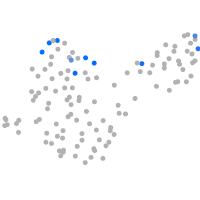
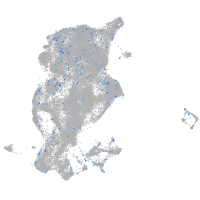
Correlated gene expression
Positive correlation
Negative correlation
Gene
r
Gene
r
si:ch211-195b15.7
0.084
col5a1
-0.023
LOC108179642
0.069
cdh11
-0.021
LOC101884729
0.061
col1a2
-0.020
capn3a
0.055
col1a1a
-0.020
CU074421.1
0.054
col1a1b
-0.018
si:ch211-197n1.2
0.054
fstl1b
-0.018
si:dkey-246j6.3
0.052
postnb
-0.017
LOC100537702
0.052
sparc
-0.017
LOC101887019
0.049
itgb1a
-0.017
si:dkey-219e20.2
0.049
col12a1a
-0.016
pimr168
0.049
lama4
-0.016
olfcj1
0.048
col11a1b
-0.016
kcna2a
0.047
loxl2a
-0.016
BX547934.1
0.047
mmp14a
-0.016
npm1a
0.046
cd248a
-0.015
galr2a
0.046
dcn
-0.015
snu13b
0.046
tnn
-0.015
nop10
0.045
col2a1b
-0.015
LOC108182577
0.044
hbbe1.3
-0.015
tomm20a
0.044
tgfbi
-0.015
rprma
0.043
antxr2a
-0.015
LOC110437749
0.043
acsm3
-0.015
ppm1g
0.043
cdkn1d
-0.015
nhp2
0.043
olfml3a
-0.014
si:dkey-58j15.10
0.042
pdgfrl
-0.014
cidec
0.042
olfml2ba
-0.014
si:ch211-196h24.1
0.042
COX3
-0.014
cnbpa
0.042
si:ch211-106j24.1
-0.014
selenoh
0.041
emilin1b
-0.014
XLOC-025657
0.040
col5a2a
-0.014
LOC103909086
0.040
hbbe1.2
-0.014
eif6
0.040
c1qtnf6a
-0.014
CU694525.1
0.039
rhogb
-0.013
bysl
0.039
ahnak
-0.013
AL954861.1
0.039
mt-co1
-0.013