Daniocell
ldlrad3 (periderm)
low density lipoprotein receptor class A domain containing 3
ZFIN
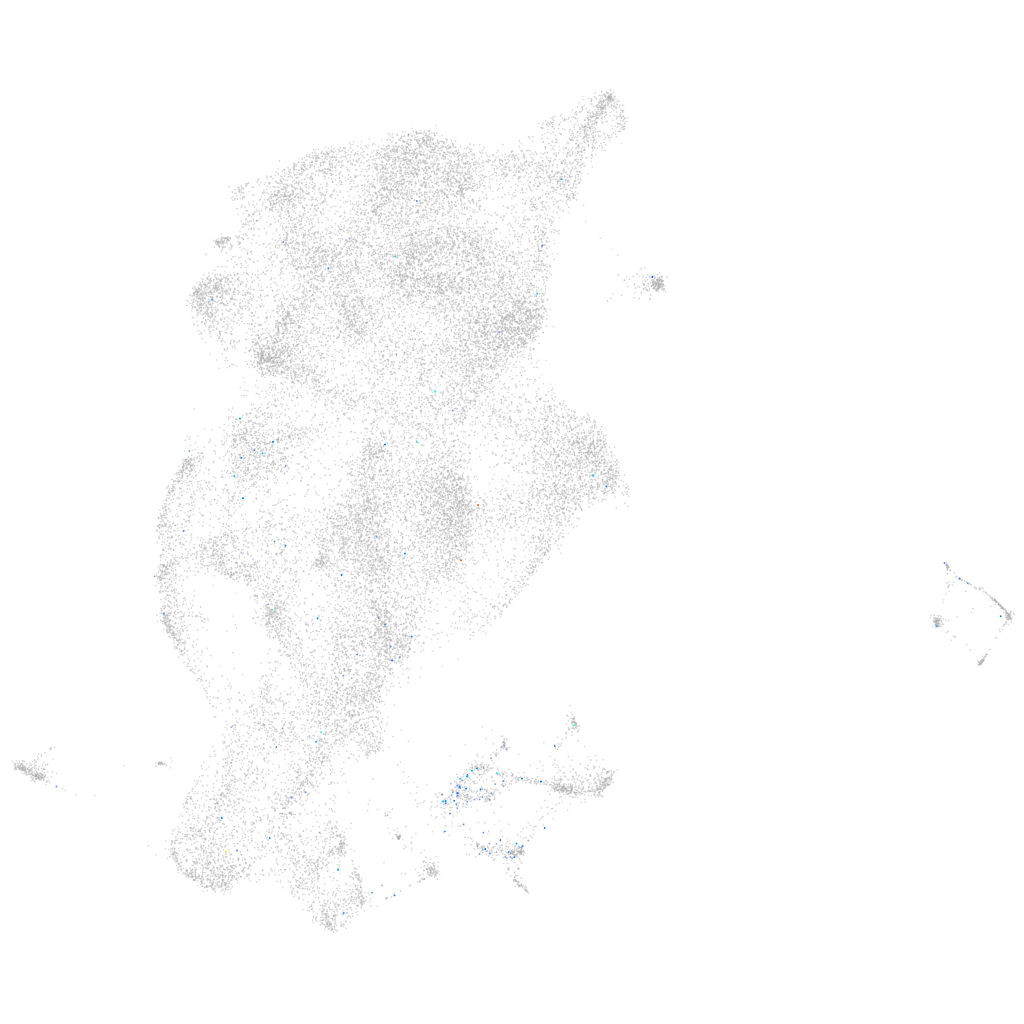
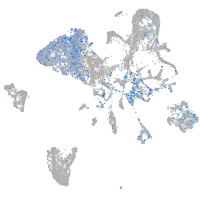
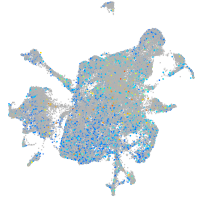
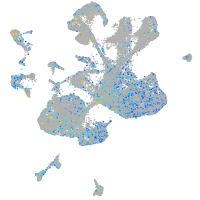
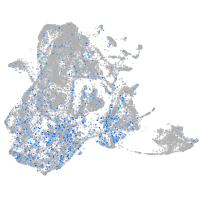
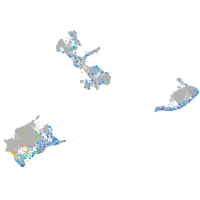
Gene expression UMAP
Display:
Expression
Stage
Other cell groups
all cells
blastomeres
PGCs
endoderm
axial mesoderm
muscle
mural cells /
non-skeletal muscle
mesenchyme
hematopoietic /
vasculature
pronephros
neural
spinal cord / glia
eye
taste / olfactory
otic / lateral line
epidermis
periderm
fin
ionocytes / mucous
pigment cells
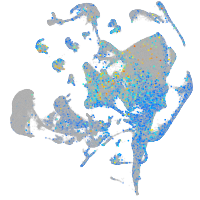
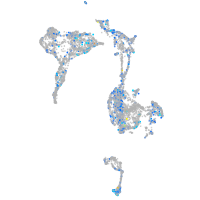
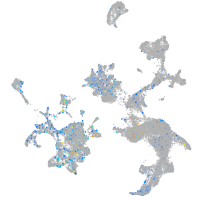
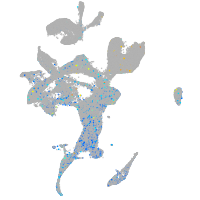
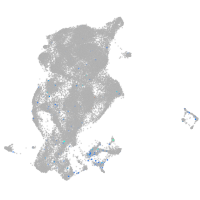
Expression by stage/cluster
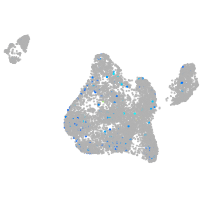
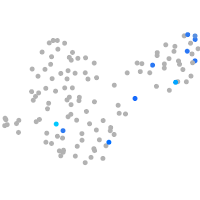
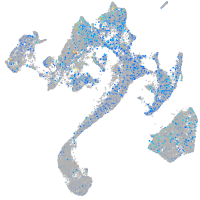
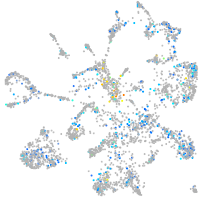
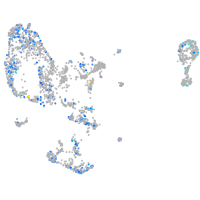
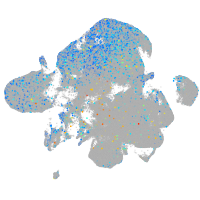
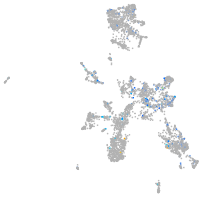
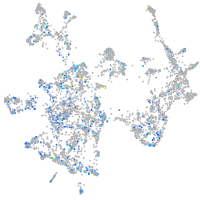
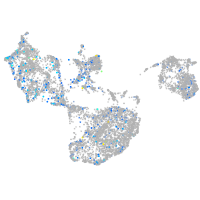
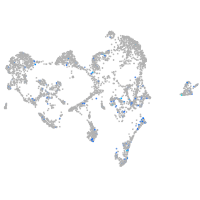
Correlated gene expression
Positive correlation
Negative correlation
Gene
r
Gene
r
pth4
0.199
si:ch211-195b11.3
-0.048
si:ch211-93n23.7
0.147
cyt1
-0.046
crygm2d1
0.132
krt5
-0.041
LOC108180020
0.120
zgc:193505
-0.036
RF00413
0.112
wu:fa03e10
-0.035
cldn5a
0.109
si:ch73-52f15.5
-0.033
cdc14aa
0.108
krt4
-0.033
wfikkn1
0.102
krtt1c19e
-0.033
uncx4.1
0.102
selenow1
-0.033
sh2d4bb
0.101
si:ch211-207n23.2
-0.033
LOC103910488
0.100
si:dkeyp-51b9.3
-0.032
lfng
0.100
actb2
-0.031
ntn1a
0.099
abcb5
-0.031
mdka
0.099
si:dkey-33i11.9
-0.030
si:ch73-21g5.7
0.098
cfl1l
-0.030
her15.1
0.097
si:dkey-16p21.8
-0.030
CR925737.1
0.096
eef1da
-0.029
wnt16
0.095
s100v2
-0.029
tspan7
0.094
krt17
-0.029
LOC798783
0.094
selenow2b
-0.029
XLOC-003690
0.093
rplp2
-0.028
XLOC-003689
0.092
anxa1a
-0.028
LOC101882959
0.092
icn2
-0.027
ipcef1
0.092
capns1a
-0.027
hmgb1b
0.091
s100w
-0.026
si:ch211-186j3.3
0.091
pycard
-0.026
notch3
0.090
eevs
-0.026
sult3st4
0.090
ezrb
-0.026
marcksl1a
0.088
dhrs13a.2
-0.025
FP101883.1
0.088
scel
-0.025
slx4ip
0.087
tcnbb
-0.025
BX649448.3
0.086
tdh
-0.024
LOC110440016
0.086
CABZ01027551.1
-0.024
si:ch211-222l21.1
0.085
pnp5a
-0.024
her12
0.085
fuca1.1
-0.024