Daniocell
ksr2 (periderm)
kinase suppressor of ras 2
ZFIN
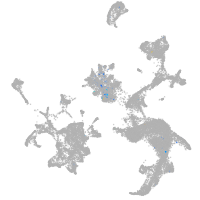
Gene expression UMAP
Display:
Expression
Stage
Other cell groups
all cells
blastomeres
PGCs
endoderm
axial mesoderm
muscle
mural cells /
non-skeletal muscle
mesenchyme
hematopoietic /
vasculature
pronephros
neural
spinal cord / glia
eye
taste / olfactory
otic / lateral line
epidermis
periderm
fin
ionocytes / mucous
pigment cells
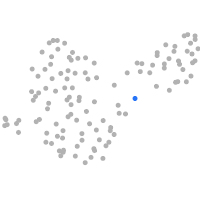
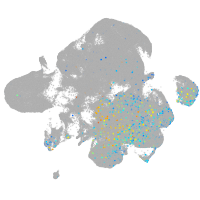
Expression by stage/cluster
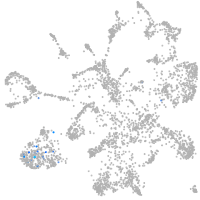
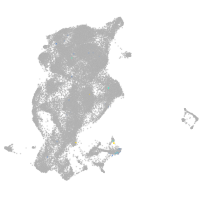
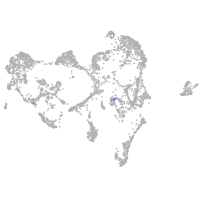
Correlated gene expression
Positive correlation
Negative correlation
Gene
r
Gene
r
si:ch211-113e8.5
0.297
ckap4
-0.030
cpne8
0.296
wu:fb18f06
-0.029
LOC101885065
0.260
cast
-0.026
LOC110438334
0.251
prr13
-0.025
LOC110439395
0.232
mid1ip1a
-0.023
FO834800.2
0.226
rpl5a
-0.023
kctd12b
0.222
tcima
-0.022
drd1a
0.200
cst14b.1
-0.021
adipoqb
0.191
cd9b
-0.021
si:ch73-380n15.2
0.190
rps6
-0.020
CABZ01068244.1
0.186
rpl34
-0.020
itsn2a
0.183
anxa1a
-0.020
sgsm3
0.170
si:ch211-79k12.1
-0.020
LOC100330136
0.168
agr1
-0.020
kcns3a
0.161
cyt1
-0.020
cacna2d4b
0.159
cldnb
-0.020
pbx3a
0.157
eef1da
-0.020
pcdh1g32
0.154
zgc:110333
-0.019
CR356233.1
0.153
cldne
-0.019
slc8a2b
0.152
cyt1l
-0.019
sez6a
0.150
cfl1l
-0.019
ccl34a.4
0.149
rhoca
-0.019
cacna1fb
0.148
krt4
-0.019
zgc:153157
0.148
capns1a
-0.019
kcnk10a
0.147
si:ch211-125o16.4
-0.019
CR751602.1
0.144
dhrs13a.2
-0.018
kcnj19b
0.141
stx11b.1
-0.018
PAQR9
0.140
rpl15
-0.018
fam43b
0.140
stard14
-0.018
cart2
0.139
ezrb
-0.018
XLOC-006525
0.139
zgc:174935
-0.018
mep1a.2
0.136
elovl1a
-0.018
mnx2b
0.135
sec61b
-0.017
vsnl1a
0.134
dsg2.1
-0.017
CABZ01102115.1
0.133
rsl24d1
-0.017