Daniocell
kpna5 (pigment cells)
karyopherin alpha 5 (importin alpha 6)
ZFIN
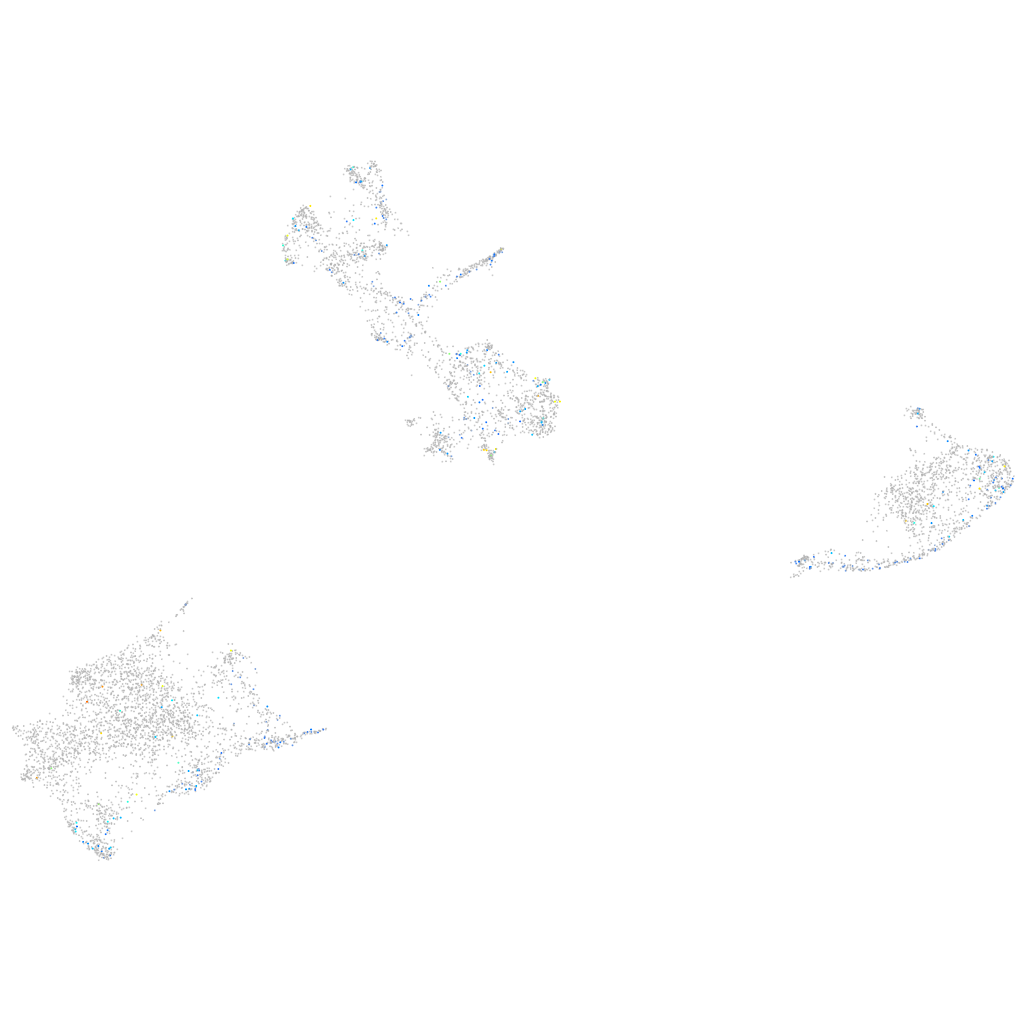
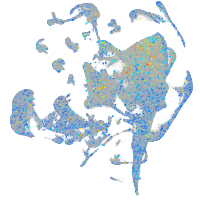
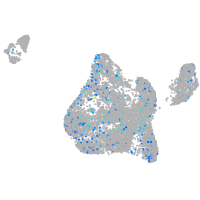
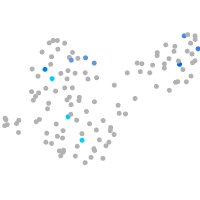
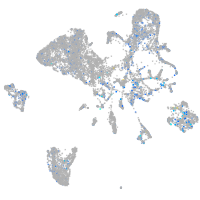
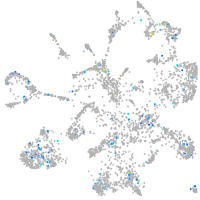
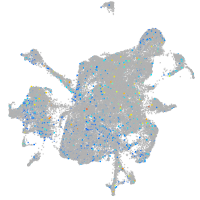
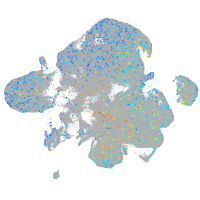
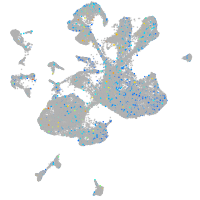
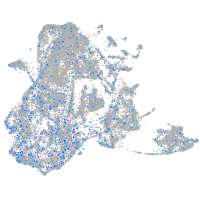
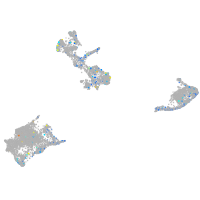
Gene expression UMAP
Display:
Expression
Stage
Other cell groups
all cells
blastomeres
PGCs
endoderm
axial mesoderm
muscle
mural cells /
non-skeletal muscle
mesenchyme
hematopoietic /
vasculature
pronephros
neural
spinal cord / glia
eye
taste / olfactory
otic / lateral line
epidermis
periderm
fin
ionocytes / mucous
pigment cells
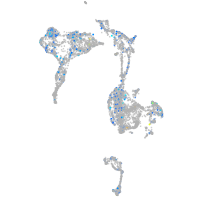
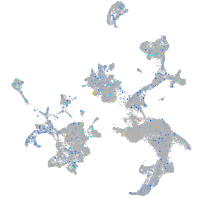
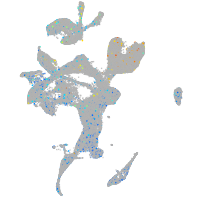
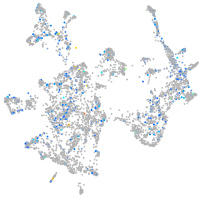
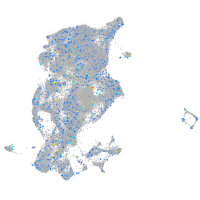
Expression by stage/cluster
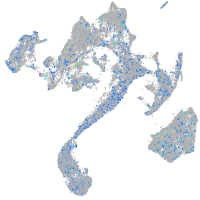
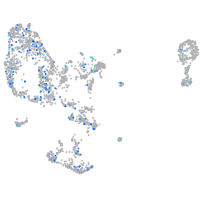
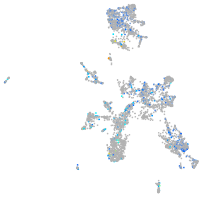
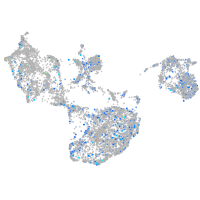
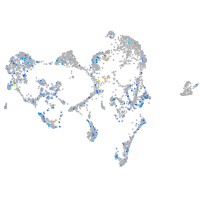
Correlated gene expression
Positive correlation
Negative correlation
Gene
r
Gene
r
BX649388.2
0.135
si:dkey-251i10.2
-0.050
si:dkeyp-79b7.12
0.130
gch2
-0.048
kcne4
0.128
sult1st1
-0.047
LOC101882509
0.127
CABZ01021592.1
-0.046
LOC101883330
0.126
tnni2a.4
-0.042
BX901883.2
0.121
gstp1
-0.042
XLOC-023943
0.116
si:dkey-151g10.6
-0.040
map4k2
0.110
actc1b
-0.034
znf987
0.109
myhz1.1
-0.034
si:dkey-11e23.9
0.107
hbae1.1
-0.033
BX769173.1
0.107
uraha
-0.032
rltgr
0.105
slc22a7a
-0.032
FP325124.1
0.104
pts
-0.031
XLOC-011830
0.104
tmem130
-0.031
cfbl
0.104
rbp4l
-0.031
BX957317.3
0.103
paics
-0.030
musk
0.102
hbae1.3
-0.030
si:ch73-18b11.2
0.100
pvalb2
-0.029
gpa33b
0.098
krt4
-0.027
msrb2
0.097
acta1b
-0.027
faah2b
0.096
ckmb
-0.027
fam167aa
0.096
mylpfb
-0.026
CU469514.1
0.096
ttn.2
-0.026
slc8a2a
0.095
zgc:110339
-0.026
LOC100536761
0.095
mgst1.1
-0.026
si:ch211-171l17.14
0.094
prdx1
-0.025
XLOC-002639
0.094
pfn1
-0.025
LOC100330706
0.094
cyt1l
-0.025
XLOC-026582
0.093
tnnt3a
-0.025
LOC103910098
0.093
anxa1c
-0.024
BX119992.1
0.091
tpma
-0.024
tbxa2r
0.090
tnnc2
-0.024
LOC108192079
0.089
gpd1b
-0.024
si:dkey-96f10.1
0.087
si:dkey-73n8.3
-0.024
htr6
0.087
mylpfa
-0.023