Daniocell
kif1bp (axial mesoderm)
kif1 binding protein [Source:ZFIN;Acc:ZDB-GENE-070117-1989]
ZFIN
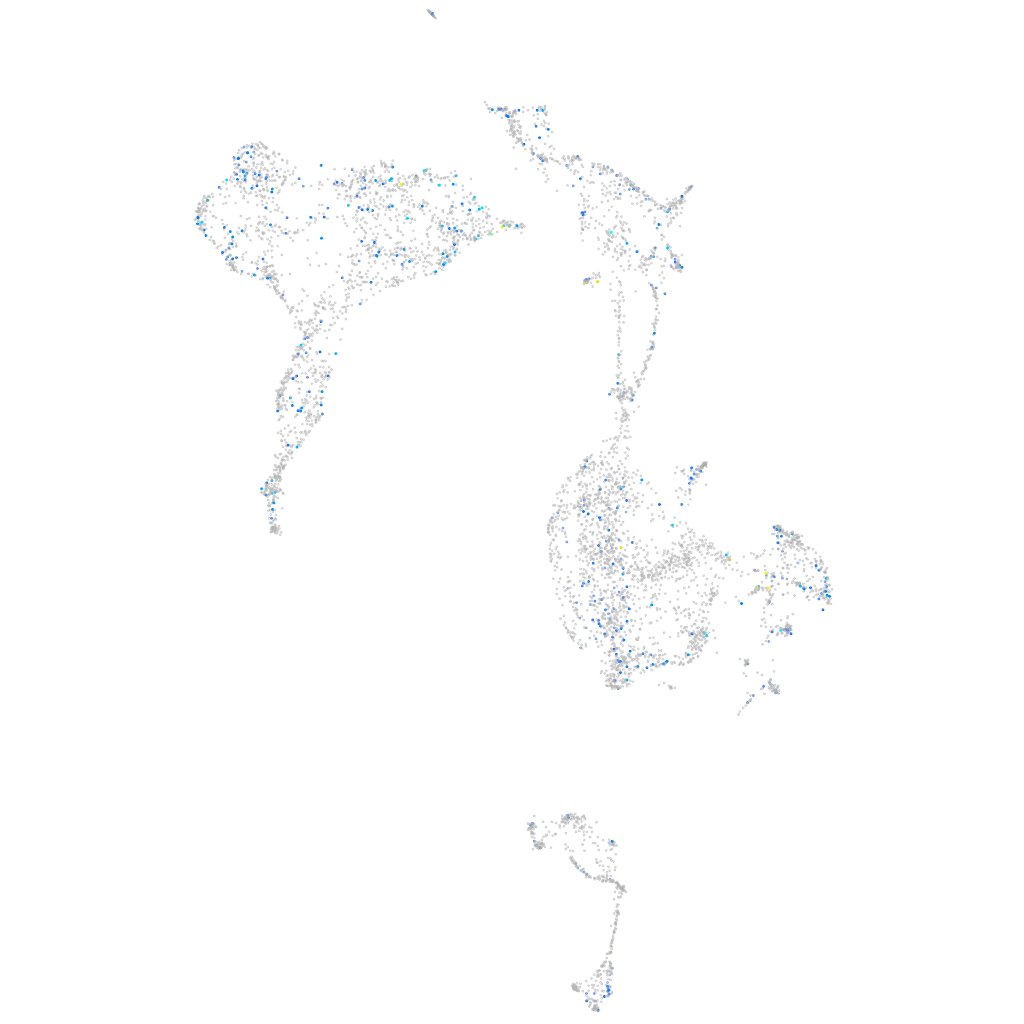
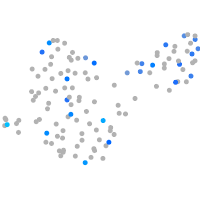
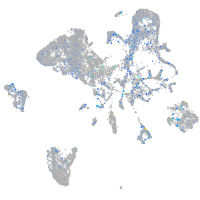
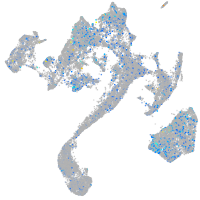
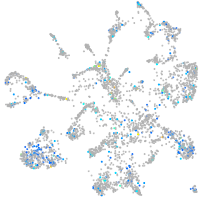
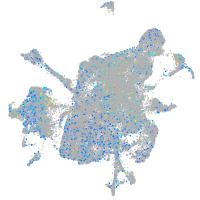
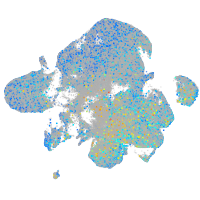
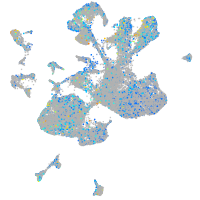
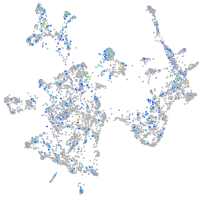
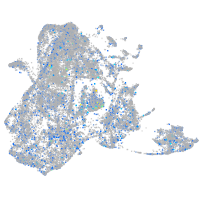
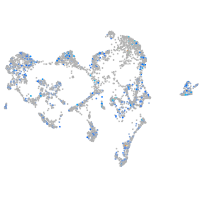
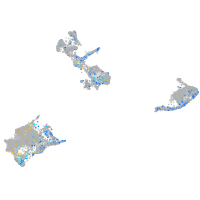
Gene expression UMAP
Display:
Expression
Stage
Other cell groups
all cells
blastomeres
PGCs
endoderm
axial mesoderm
muscle
mural cells /
non-skeletal muscle
mesenchyme
hematopoietic /
vasculature
pronephros
neural
spinal cord / glia
eye
taste / olfactory
otic / lateral line
epidermis
periderm
fin
ionocytes / mucous
pigment cells
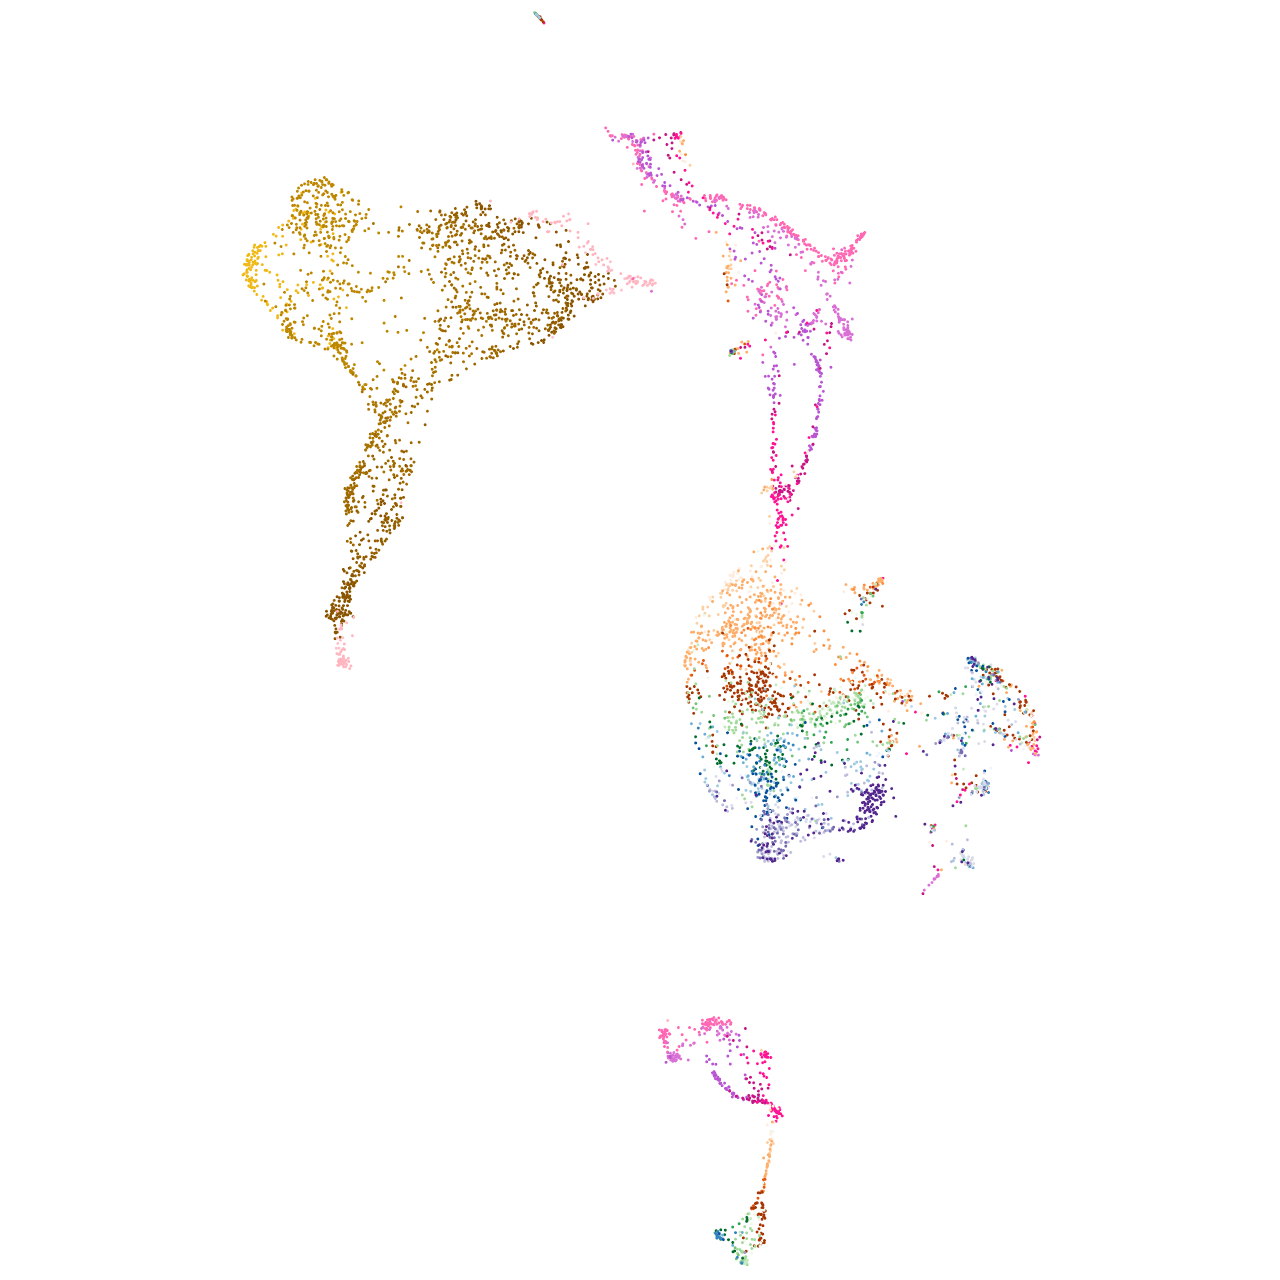
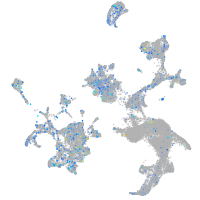
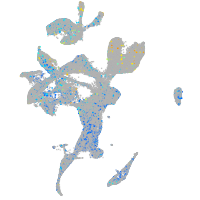
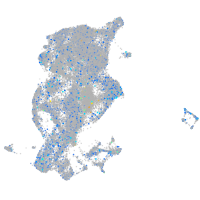
Expression by stage/cluster
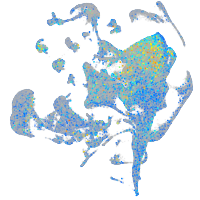
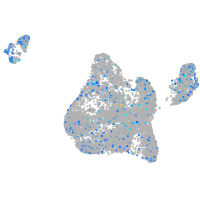
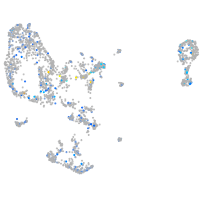
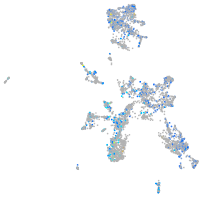
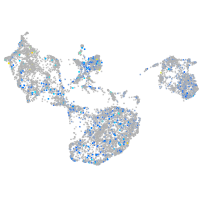
Correlated gene expression
Positive correlation
Negative correlation
Gene
r
Gene
r
LOC101882067
0.147
rps10
-0.055
BX276128.1
0.130
krt18a.1
-0.055
LOC108181409
0.127
serp1
-0.053
si:ch73-233f7.6
0.127
krt8
-0.051
BX908744.1
0.123
rpl37
-0.049
ankrd6a
0.123
si:ch73-23l24.1
-0.048
gpr132b
0.112
zgc:114188
-0.046
nts
0.112
snorc
-0.045
kcnip3b
0.111
col9a2
-0.045
XLOC-019653
0.110
srpx
-0.045
LOC110438543
0.110
zgc:113232
-0.044
XLOC-028243
0.109
col9a1b
-0.044
CU463284.2
0.107
cmn
-0.043
kiss1ra
0.104
LO018340.1
-0.043
rap1gap2b
0.101
matn4
-0.043
LOC101882729
0.101
chadla
-0.043
drd4-rs
0.100
col11a2
-0.043
syngr3b
0.099
ppib
-0.043
LOC568754
0.099
kdelr3
-0.043
cdh7a
0.098
tgfbi
-0.042
si:ch211-154e10.1
0.097
loxl1
-0.042
ak7a
0.097
cav2
-0.042
onecut3a
0.096
tmed3
-0.042
myh11b
0.095
cnpy1
-0.041
XLOC-005727
0.092
mir181b-3
-0.041
cers4b
0.092
p4hb
-0.041
wdr17
0.090
cnmd
-0.041
tjp2a
0.089
epyc
-0.040
RASGRF1
0.089
rpl38
-0.040
cort
0.089
col2a1a
-0.040
si:ch211-157b11.14
0.089
rps25
-0.040
lrfn4a
0.089
si:dkey-26g8.4
-0.039
si:dkey-225f23.4
0.089
col11a1a
-0.039
zgc:66440
0.088
ctslb
-0.039
galr1a
0.087
COLGALT1 (1 of many)
-0.039