Daniocell
kdm6a (blastomeres)
lysine (K)-specific demethylase 6A
ZFIN
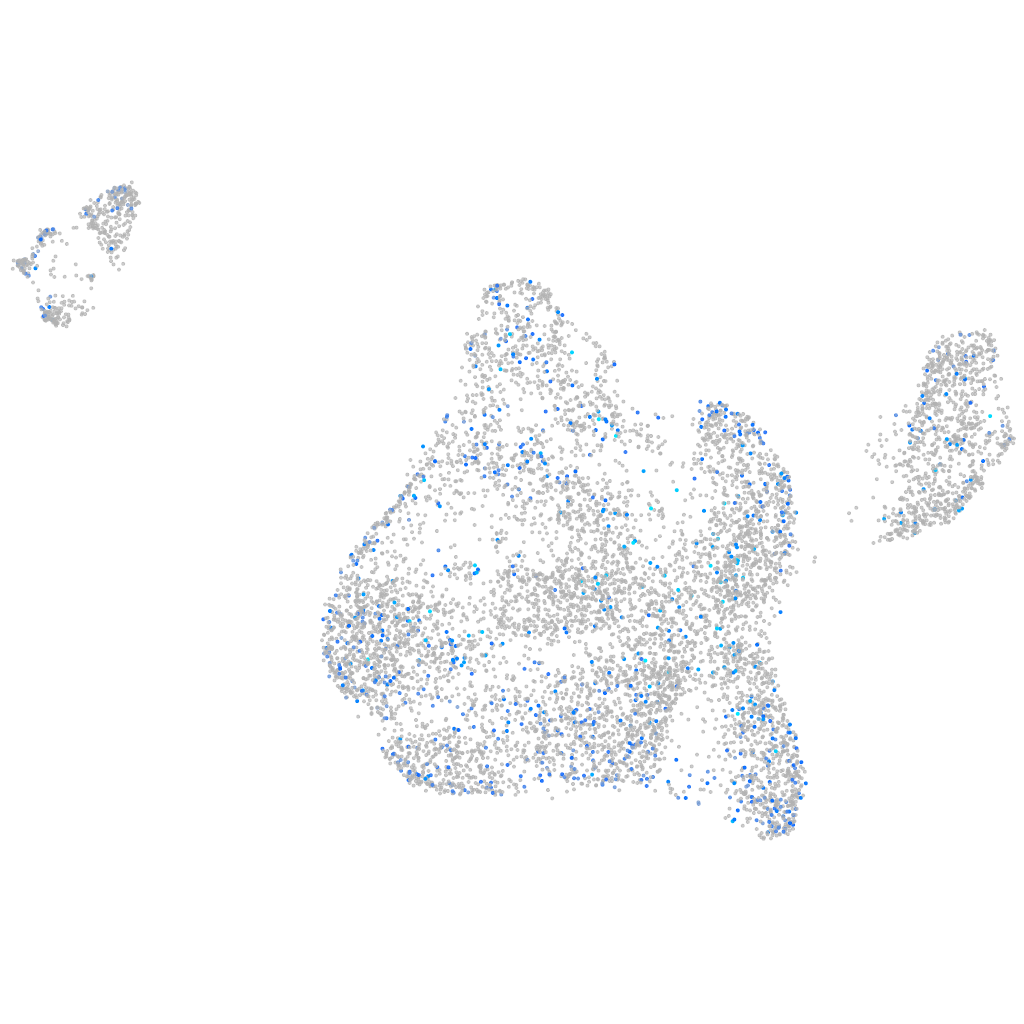
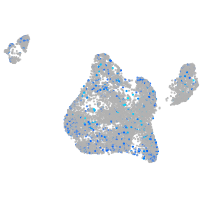
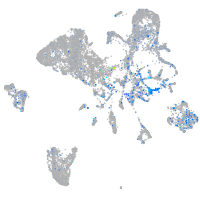
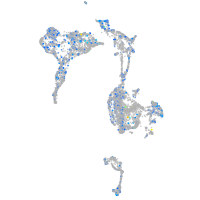
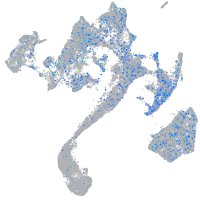
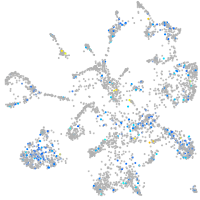
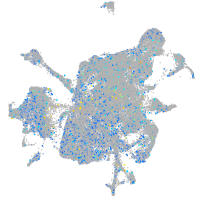
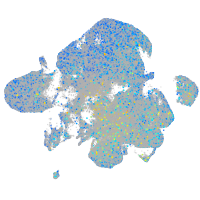
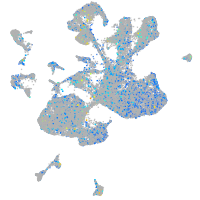
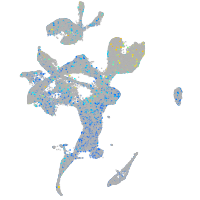
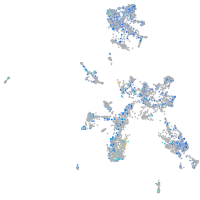
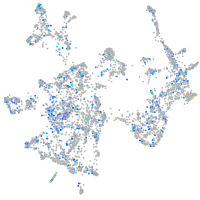
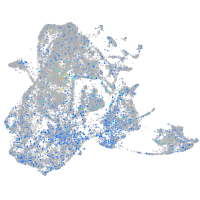
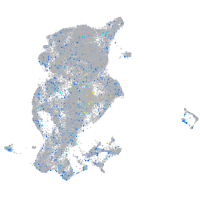
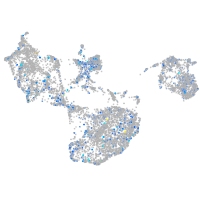
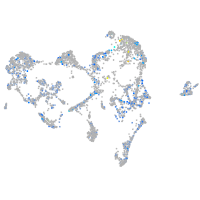
Gene expression UMAP
Display:
Expression
Stage
Other cell groups
all cells
blastomeres
PGCs
endoderm
axial mesoderm
muscle
mural cells /
non-skeletal muscle
mesenchyme
hematopoietic /
vasculature
pronephros
neural
spinal cord / glia
eye
taste / olfactory
otic / lateral line
epidermis
periderm
fin
ionocytes / mucous
pigment cells
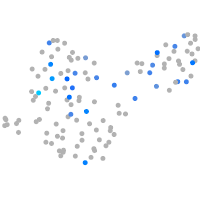
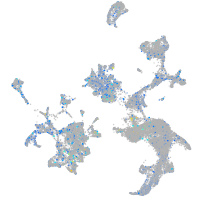
Expression by stage/cluster
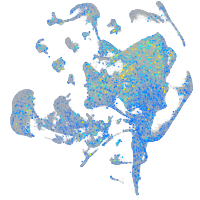
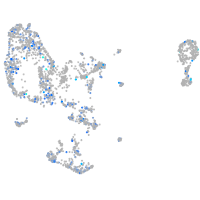
Correlated gene expression
Positive correlation
Negative correlation
Gene
r
Gene
r
si:busm1-163l24.4
0.073
rdh14b
-0.037
si:ch1073-181h11.4
0.073
NC-002333.4
-0.036
CABZ01025311.1
0.073
rp2
-0.036
carmil1
0.072
mibp
-0.036
CABZ01078767.1
0.069
rap2c
-0.035
CU914164.1
0.068
bmp15
-0.033
tigara
0.065
desi2
-0.032
btr30
0.064
akt2l
-0.032
si:dkeyp-51b9.3
0.063
tfam
-0.031
pimr70
0.063
stard14
-0.031
LOC110438343
0.063
trmt10a
-0.031
si:ch211-250e5.2
0.063
zgc:111868
-0.031
top2a
0.062
kdm7aa
-0.030
CR556712.1
0.062
cpeb4b
-0.030
si:dkey-33c12.4
0.060
gstp1
-0.030
si:dkey-20i20.10
0.060
elp2
-0.030
si:ch211-173d10.4
0.060
slc9a7
-0.030
XLOC-022718
0.059
si:ch211-241e1.5
-0.030
si:dkey-93h22.7
0.059
si:ch211-132b12.8
-0.029
LOC101883855
0.059
psat1
-0.029
phf21ab
0.058
si:dkey-21c1.8
-0.029
si:dkeyp-73b11.8
0.058
hprt1
-0.029
rps29
0.058
si:ch211-198m1.1
-0.029
CABZ01058362.1
0.058
ttc32
-0.029
LOC101886616
0.058
cldn7b
-0.029
oga
0.057
prdx1
-0.028
si:ch1073-90m23.1
0.057
ssbp3a
-0.028
si:dkey-33i11.1
0.057
rhogd
-0.028
kcnq5b
0.057
mid1ip1a
-0.028
smc3
0.056
zgc:92313
-0.028
CABZ01117752.1
0.056
zp3d.1
-0.028
ubap2b
0.055
atp5meb
-0.028
ccl34b.4
0.055
cdk5rap3
-0.028
gnaq
0.054
nipa2
-0.028
LOC108190058
0.054
h2af1al
-0.027