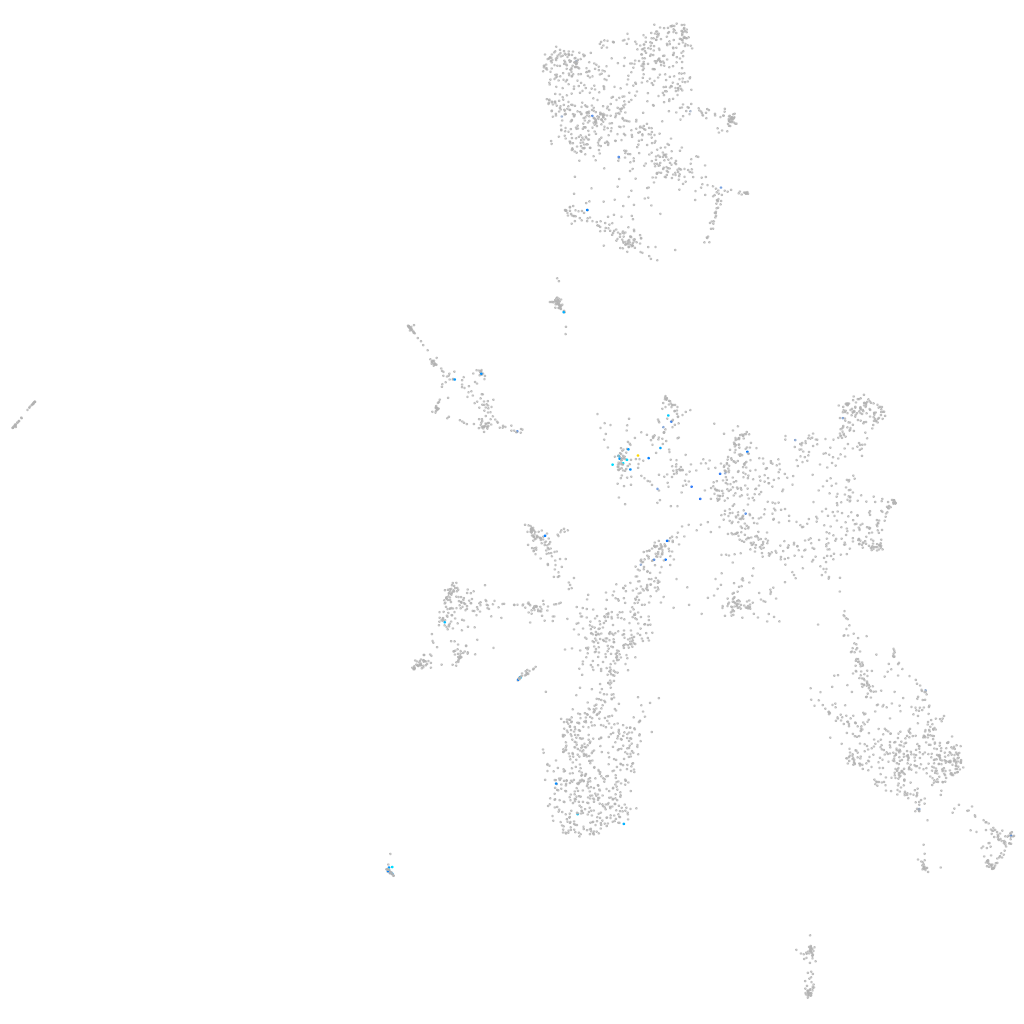
Daniocell
kcnip1b (taste / olfactory)
Kv channel interacting protein 1 b
ZFIN
Gene expression UMAP
Display:
Expression
Stage
Other cell groups
all cells
blastomeres
PGCs
endoderm
axial mesoderm
muscle
mural cells /
non-skeletal muscle
mesenchyme
hematopoietic /
vasculature
pronephros
neural
spinal cord / glia
eye
taste / olfactory
otic / lateral line
epidermis
periderm
fin
ionocytes / mucous
pigment cells
Expression by stage/cluster
Correlated gene expression
Positive correlation
Negative correlation
Gene
r
Gene
r
AL928707.3
0.263
epcam
-0.066
tal1
0.230
lgals3b
-0.065
LOC103909382
0.227
cldnb
-0.065
LOC108183778
0.214
sox3
-0.063
XLOC-034373
0.214
s100a10b
-0.063
ANO2 (1 of many)
0.214
phlda2
-0.060
LOC555502
0.214
padi2
-0.059
LOC108191704
0.213
si:dkey-87o1.2
-0.057
foxb2
0.213
ctsla
-0.057
LOC101882492
0.211
tagln2
-0.056
birc6-as2
0.210
jupa
-0.056
cspg5a
0.210
f11r.1
-0.054
si:ch211-284e13.14
0.207
s100v1
-0.054
sdhda
0.201
oclna
-0.054
nos1apb
0.198
sdc4
-0.054
ptchd4
0.196
cldn7b
-0.054
nfixb
0.195
pfn1
-0.053
syt3
0.192
zgc:110339
-0.053
BX572620.1
0.190
dnase1l4.1
-0.053
ACOT12
0.187
si:ch73-335l21.4
-0.053
si:ch73-127m5.1
0.187
krt18a.1
-0.052
scpp1
0.186
cfl1l
-0.052
tbx19
0.185
glulb
-0.052
gjd1a
0.185
her6
-0.052
slc6a1b
0.184
tmem176l.4
-0.051
ralgps1
0.180
arhgef5
-0.051
CR381647.2
0.178
cd9b
-0.051
chrna6
0.178
krt8
-0.051
VSTM2A
0.178
fgfbp1b
-0.050
ywhag1
0.177
sult6b1
-0.050
rgs7bpb
0.176
hmgb2a
-0.050
XLOC-009917
0.174
bzw1b
-0.049
si:dkey-192l18.9
0.173
dpy30
-0.049
CABZ01092942.1
0.173
slc20a1b
-0.049
scube1
0.172
elf3
-0.049