Daniocell
kank1a (periderm)
KN motif and ankyrin repeat domains 1a
ZFIN
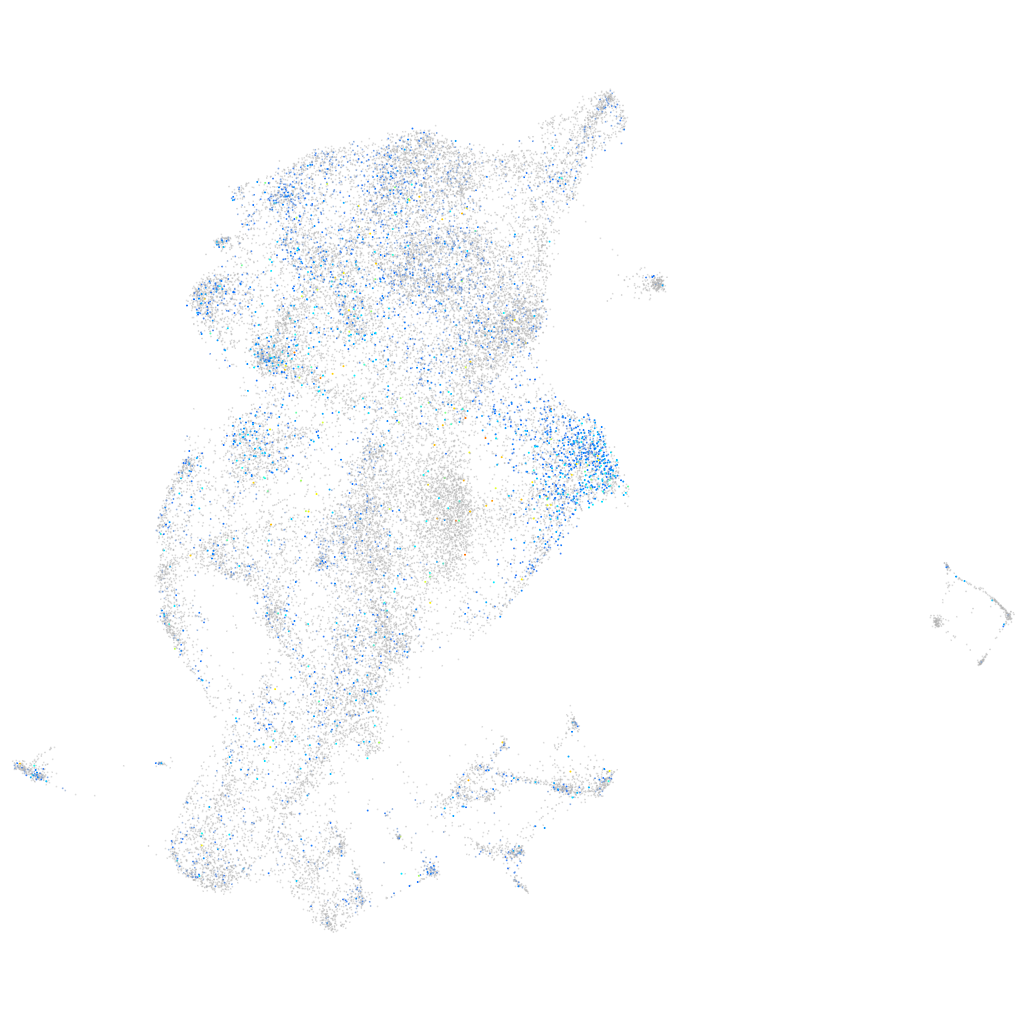
Gene expression UMAP
Display:
Expression
Stage
Other cell groups
all cells
blastomeres
PGCs
endoderm
axial mesoderm
muscle
mural cells /
non-skeletal muscle
mesenchyme
hematopoietic /
vasculature
pronephros
neural
spinal cord / glia
eye
taste / olfactory
otic / lateral line
epidermis
periderm
fin
ionocytes / mucous
pigment cells
Expression by stage/cluster
Correlated gene expression
Positive correlation
Negative correlation
Gene
r
Gene
r
si:dkey-33c14.3
0.138
cyt1l
-0.088
emx3
0.136
krtt1c19e
-0.079
wu:fa03e10
0.126
krt4
-0.079
bhlha9
0.124
agr1
-0.078
im:7150988
0.122
zgc:175088
-0.072
lrrc17
0.114
ponzr3
-0.066
zgc:123217
0.114
adh8b
-0.060
sp8b
0.114
krt92
-0.058
si:ch211-207n23.2
0.113
ckap4
-0.057
krt97
0.113
ponzr4
-0.056
si:ch211-264f5.6
0.103
zgc:193505
-0.055
LOC108190590
0.103
fut9d
-0.051
klhl24b
0.101
ubap1la
-0.051
CABZ01027551.1
0.100
cxcl14
-0.049
trim35-27
0.100
tgm1l4
-0.048
zgc:111983
0.100
aep1
-0.048
glipr2
0.100
cyt1
-0.048
b2ml
0.099
cyp2y3
-0.047
sp9
0.099
krt5
-0.047
sp8a
0.098
si:dkey-195m11.8
-0.047
si:ch211-125o16.4
0.097
gale
-0.047
si:dkey-92i15.4
0.094
si:ch211-202f3.3
-0.046
si:dkey-187j14.4
0.094
tmsb4x
-0.046
si:dkey-248g15.3
0.093
cst14b.1
-0.045
cebpa
0.092
pmm2
-0.044
spint2
0.091
ost4
-0.044
zfand5a
0.091
hmga1a
-0.044
hspa8
0.090
pabpc1b
-0.044
ctsla
0.090
zgc:110216
-0.043
dnajb6b
0.088
ywhaz
-0.043
si:dkey-19b23.12
0.086
osgn1
-0.043
abcb5
0.086
si:dkeyp-86h10.3
-0.042
amd1
0.085
prdx1
-0.041
mslna
0.085
XLOC-041945
-0.040
LOC101882251
0.084
prrc1
-0.039