Daniocell
il17rc (glial cells / spinal cord)
interleukin 17 receptor C
ZFIN
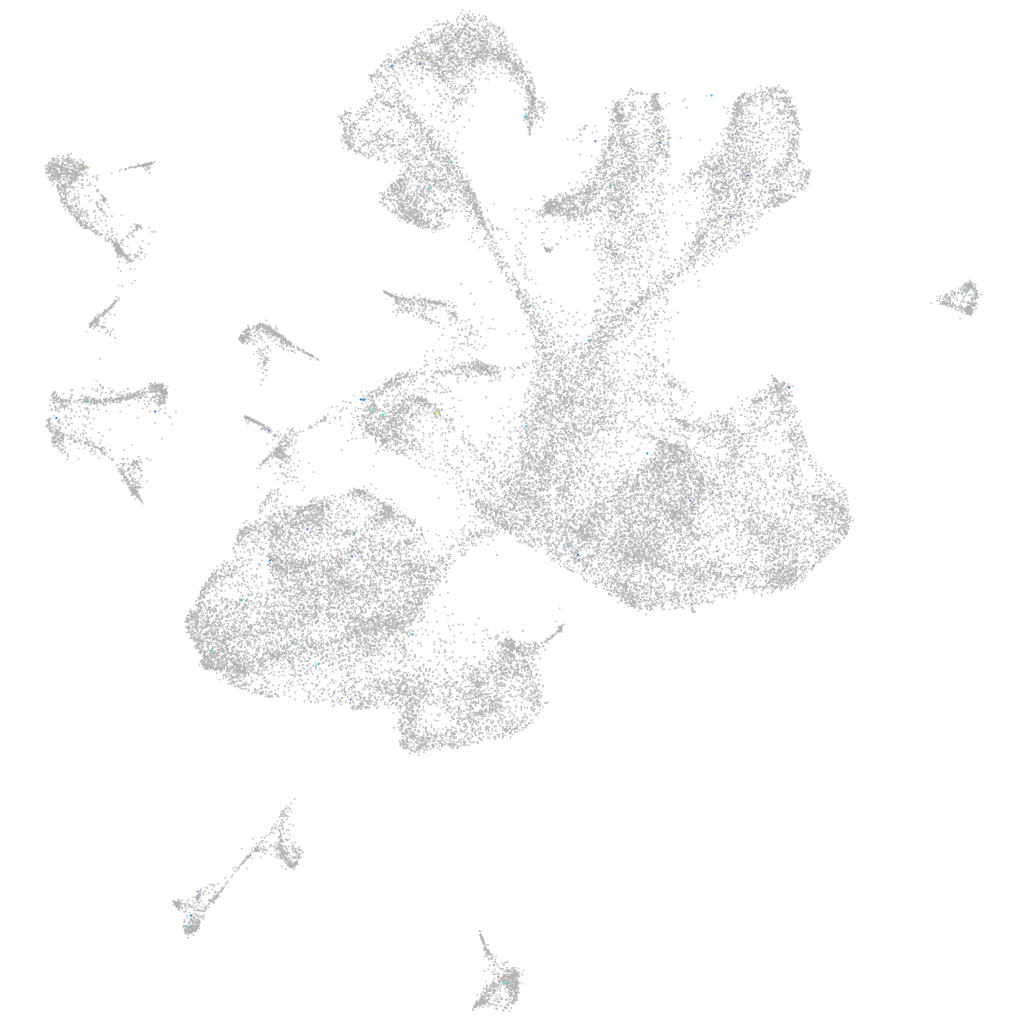
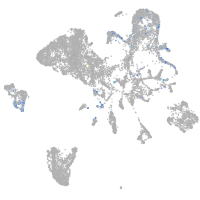
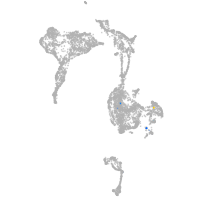
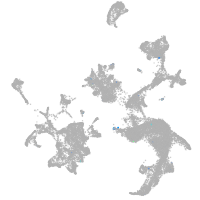
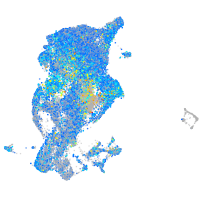
Gene expression UMAP
Display:
Expression
Stage
Other cell groups
all cells
blastomeres
PGCs
endoderm
axial mesoderm
muscle
mural cells /
non-skeletal muscle
mesenchyme
hematopoietic /
vasculature
pronephros
neural
spinal cord / glia
eye
taste / olfactory
otic / lateral line
epidermis
periderm
fin
ionocytes / mucous
pigment cells
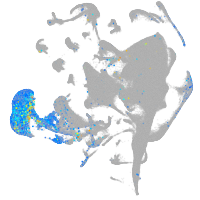
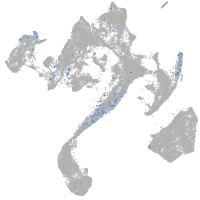
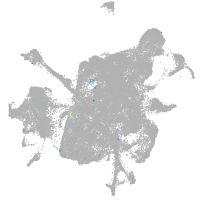
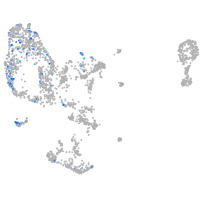
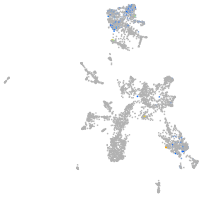
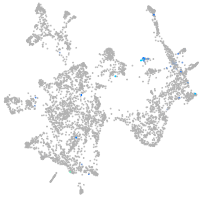
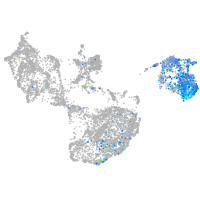
Expression by stage/cluster
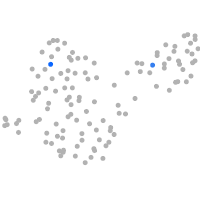
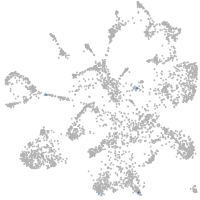
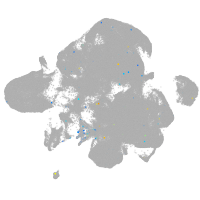
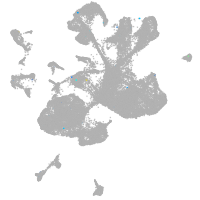
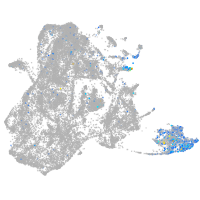
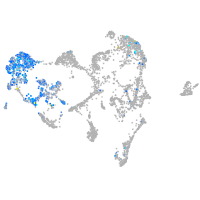
Correlated gene expression
Positive correlation
Negative correlation
Gene
r
Gene
r
LOC101884093
0.213
rpl37
-0.021
CU571315.2
0.201
hmgb2b
-0.021
si:ch211-149e23.4
0.165
hnrnpaba
-0.021
si:ch73-289h5.5
0.162
rps8a
-0.021
crfb12
0.134
rps14
-0.020
LOC101883160
0.133
zgc:114188
-0.019
CR550302.2
0.124
rpl36a
-0.019
si:ch211-15j1.4
0.117
tma7
-0.019
BX649388.1
0.107
rpl39
-0.019
XLOC-039086
0.104
khdrbs1a
-0.018
si:dkey-30c15.13
0.101
rpl28
-0.018
adgrg7.1
0.100
rps10
-0.018
ucn3l
0.096
ddx39ab
-0.018
si:ch1073-155h21.1
0.093
snrpg
-0.018
XLOC-009918
0.086
rpl11
-0.018
si:ch211-117n7.7
0.083
hmga1a
-0.018
LOC100331080
0.081
rps20
-0.018
AL935195.1
0.081
srsf5a
-0.018
lhx8a
0.080
rpl8
-0.018
il4
0.080
idh2
-0.018
LOC100537163
0.079
si:ch211-288g17.3
-0.017
LOC103910196
0.077
cct3
-0.017
XLOC-004547
0.076
rplp2l
-0.017
si:ch211-207n23.2
0.075
taf15
-0.017
CU856343.1
0.073
ptmab
-0.017
BX511021.2
0.072
rpl14
-0.017
LOC110439518
0.071
eef2b
-0.017
crygm2d15
0.071
rpl15
-0.017
ifit16
0.070
rpl18a
-0.016
CR927456.1
0.068
hnrnpa0l
-0.016
tph2
0.067
rps24
-0.016
xkr8.2
0.067
srrm2
-0.016
ora6
0.066
anp32b
-0.016
cers3a
0.065
cdca7b
-0.016
si:dkey-187j14.4
0.065
hmgb2a
-0.016