Daniocell
igsf3 (blastomeres)
"immunoglobulin superfamily, member 3"
ZFIN
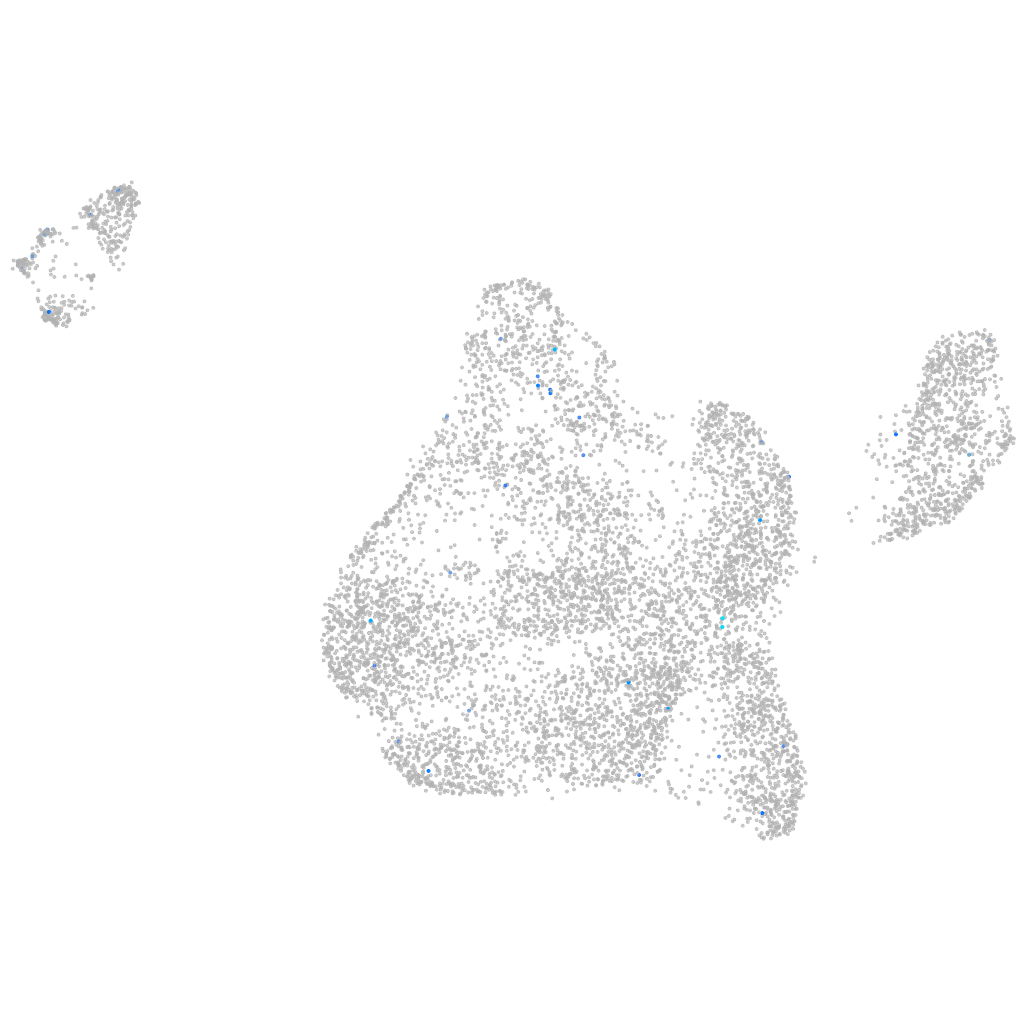
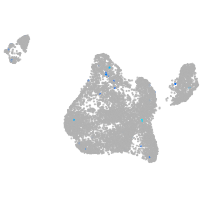
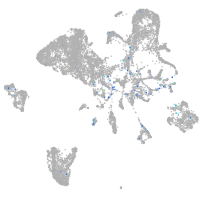
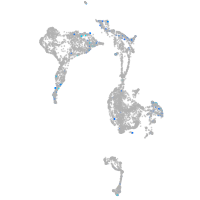
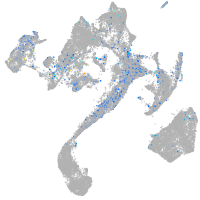
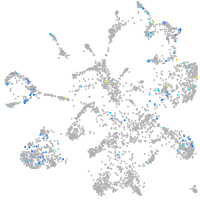
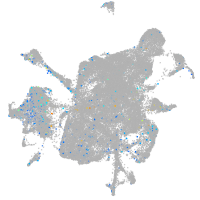
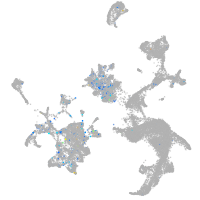
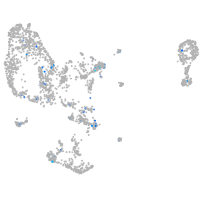
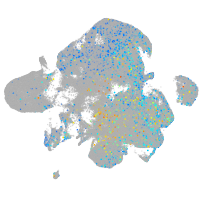
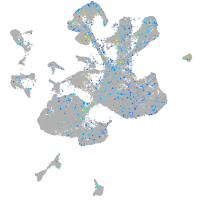
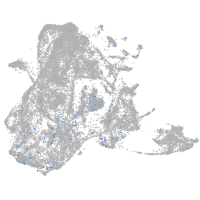
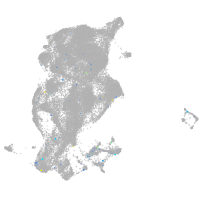
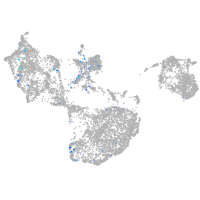
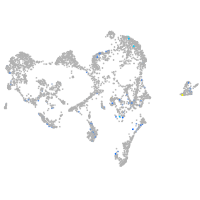
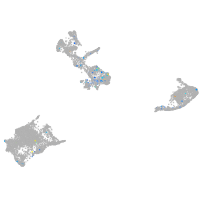
Gene expression UMAP
Display:
Expression
Stage
Other cell groups
all cells
blastomeres
PGCs
endoderm
axial mesoderm
muscle
mural cells /
non-skeletal muscle
mesenchyme
hematopoietic /
vasculature
pronephros
neural
spinal cord / glia
eye
taste / olfactory
otic / lateral line
epidermis
periderm
fin
ionocytes / mucous
pigment cells
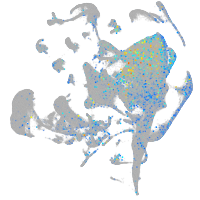
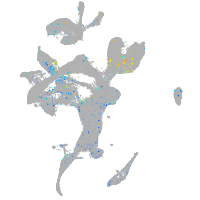
Expression by stage/cluster
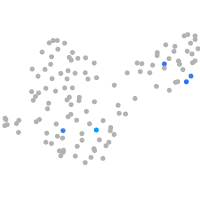
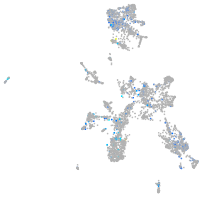
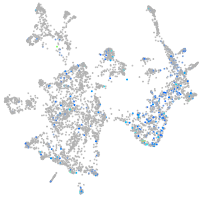
Correlated gene expression
Positive correlation
Negative correlation
Gene
r
Gene
r
baiap2l2b
0.282
CR383676.1
-0.045
nppa
0.245
srsf5a
-0.037
arhgef15
0.186
marcksl1b
-0.037
XLOC-004796
0.177
hmgn6
-0.034
serpina1l
0.164
si:ch1073-80i24.3
-0.033
BX004774.2
0.154
hspb1
-0.031
BX649431.1
0.148
si:dkey-23i12.5
-0.030
LOC101884441
0.148
apoeb
-0.029
si:dkeyp-27c8.1
0.143
pabpc1a
-0.029
il17a/f2
0.135
rps9
-0.029
si:dkey-234i14.6
0.133
knop1
-0.028
traf3ip2l
0.127
cnbpb
-0.028
LOC101885678
0.126
lrwd1
-0.028
XLOC-032394
0.125
rpl7a
-0.028
f7i
0.125
rpl10a
-0.027
LOC110438643
0.122
tuba8l4
-0.027
LOC108181220
0.121
rpl32
-0.027
fgf13a
0.118
aldob
-0.027
LOC110440010
0.116
pomp
-0.027
AL954142.1
0.114
sox3
-0.027
FP102122.3
0.114
rplp1
-0.026
rbl2
0.113
rps27.2
-0.026
ngfa
0.113
hmgn2
-0.026
ldlra
0.109
bub3
-0.025
TMEM132D
0.109
rpl21
-0.025
LOC108190166
0.108
psmb3
-0.025
LOC101882989
0.106
nsa2
-0.025
si:dkey-58f10.4
0.105
si:dkeyp-69c1.6
-0.025
dcn
0.104
mcm2
-0.025
mmp21
0.101
rpsa
-0.025
si:dkey-9i23.8
0.101
rpl38
-0.024
si:dkey-16l2.20
0.099
hnrnpa0b
-0.024
fam110c
0.097
rpl22
-0.024
BX324207.1
0.096
elof1
-0.024
si:dkey-225f23.5
0.096
si:ch211-152c2.3
-0.024