Daniocell
ighmbp2 (blastomeres)
immunoglobulin mu DNA binding protein 2
ZFIN
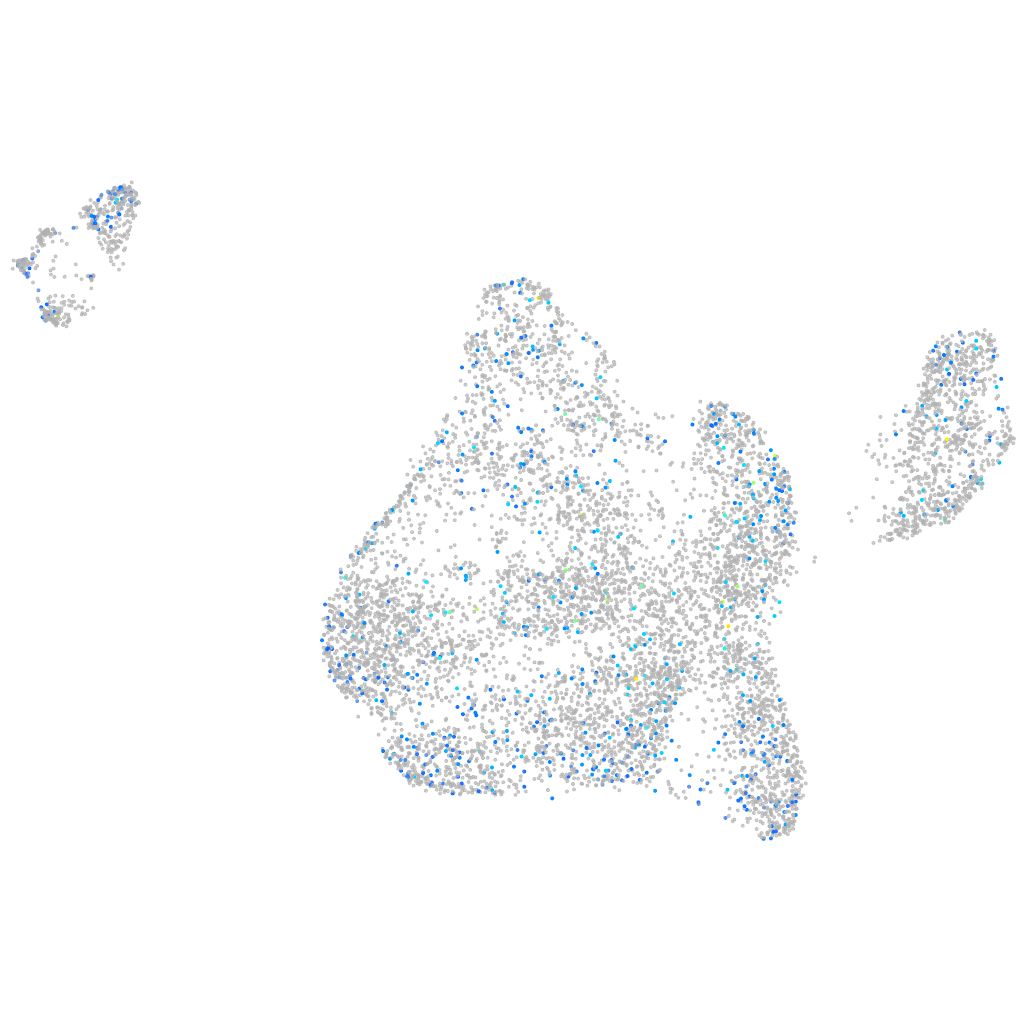
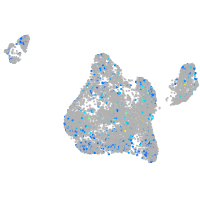
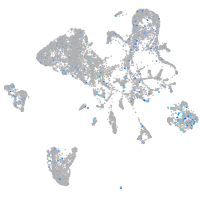
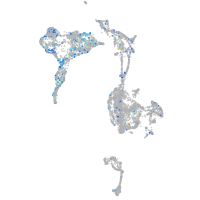
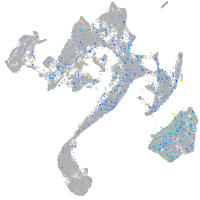
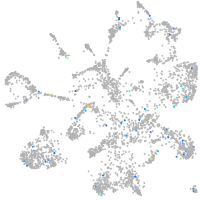
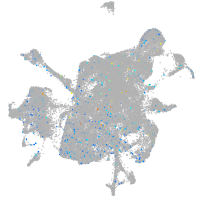
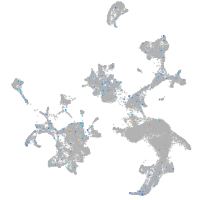
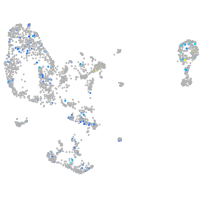
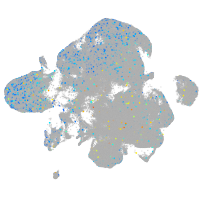
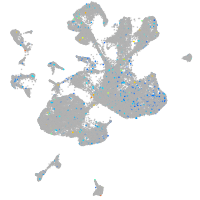
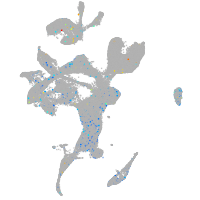
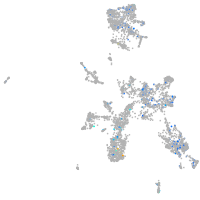
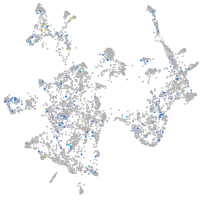
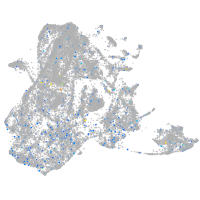
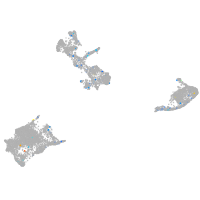
Gene expression UMAP
Display:
Expression
Stage
Other cell groups
all cells
blastomeres
PGCs
endoderm
axial mesoderm
muscle
mural cells /
non-skeletal muscle
mesenchyme
hematopoietic /
vasculature
pronephros
neural
spinal cord / glia
eye
taste / olfactory
otic / lateral line
epidermis
periderm
fin
ionocytes / mucous
pigment cells
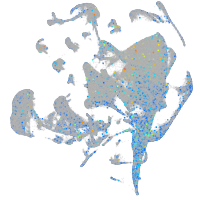
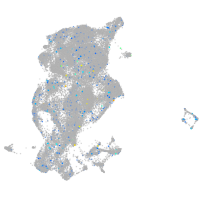
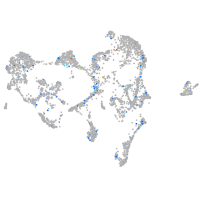
Expression by stage/cluster
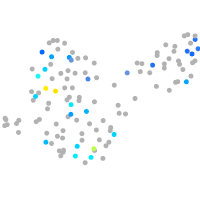
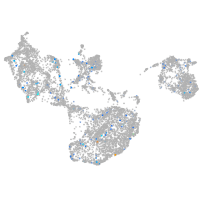
Correlated gene expression
Positive correlation
Negative correlation
Gene
r
Gene
r
pcyt1bb
0.082
NC-002333.4
-0.033
CU469584.1
0.079
si:dkey-33c14.7
-0.029
zgc:153704
0.075
si:dkey-165a24.10
-0.028
CABZ01078767.1
0.075
elac1
-0.027
LOC101885015
0.072
gcsha
-0.027
LOC110439481
0.070
vma21
-0.027
FP015810.1
0.070
XLOC-004652
-0.027
si:dkey-111f13.5
0.069
KCTD15
-0.026
carmil1
0.068
si:dkeyp-53d3.3
-0.025
cd248b
0.065
LOC108181760
-0.025
tyk2
0.061
ube2d2
-0.025
zp2l2
0.061
SPAG9
-0.024
CU929240.1
0.060
adh8b
-0.024
CR855311.1
0.060
xylt1
-0.023
tfcp2l1
0.060
CABZ01113812.1
-0.023
LOC108192140
0.059
kti12
-0.023
si:ch211-147k10.5
0.059
gtf3c2
-0.022
XLOC-023308
0.059
LOC103908923
-0.022
BX957336.2
0.058
zgc:154164
-0.022
CABZ01044764.2
0.057
LOC799039
-0.022
prkar2ab
0.057
XLOC-019549
-0.022
ftr79
0.057
ppp1r15a
-0.022
BX769173.1
0.057
pm20d1.1
-0.022
CR589947.3
0.056
paxx
-0.022
hspb15
0.056
agmat
-0.022
CABZ01076275.1
0.055
ciao2a
-0.021
zgc:153913
0.055
henmt1
-0.021
fbxl3a
0.055
NAV1
-0.021
LOC110438002
0.055
ntpcr
-0.021
trim66
0.054
zgc:171445
-0.021
LOC110438170
0.054
triqk
-0.021
reep6
0.054
XLOC-021899
-0.021
limd1b
0.053
znf1047
-0.021
aqp4
0.052
kras
-0.021
ssb
0.052
si:dkey-163m14.7
-0.021