insulin-like growth factor 1a receptor
ZFIN 
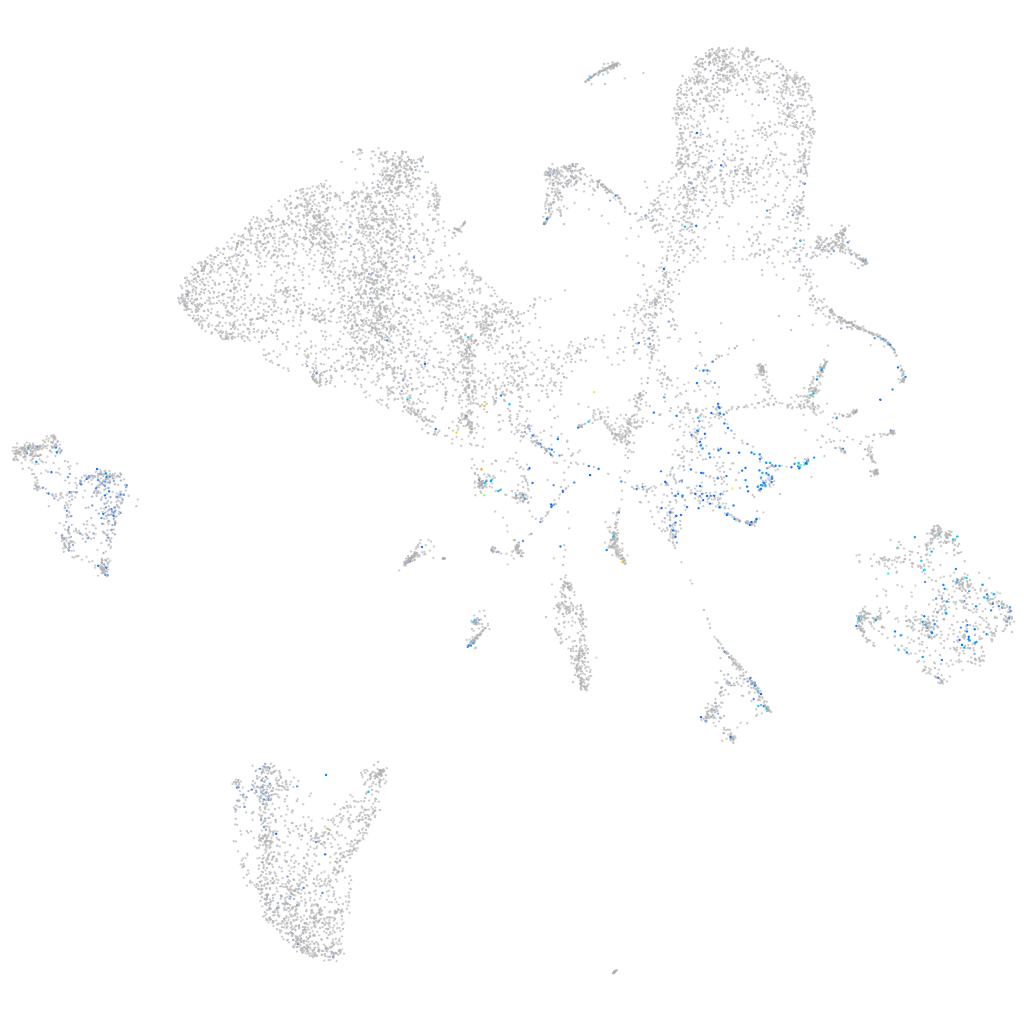
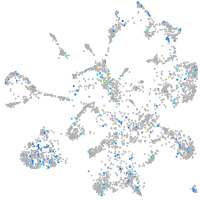
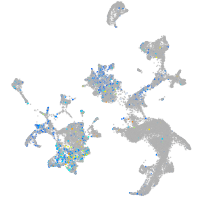
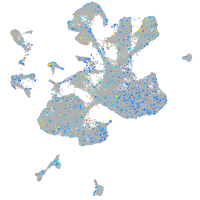
Expression by stage/cluster


Correlated gene expression


| Positive correlation | Negative correlation | ||
| Gene | r | Gene | r |
| hapln1b | 0.215 | gapdh | -0.190 |
| fgfrl1b | 0.213 | gamt | -0.170 |
| tpm4a | 0.208 | eno3 | -0.165 |
| lin28a | 0.206 | fbp1b | -0.157 |
| sall4 | 0.204 | ahcy | -0.156 |
| txnipa | 0.196 | gpx4a | -0.154 |
| cnn2 | 0.195 | aldob | -0.152 |
| h3f3d | 0.194 | apoa4b.1 | -0.152 |
| nrp2b | 0.193 | apoc2 | -0.151 |
| fbn2b | 0.193 | gatm | -0.149 |
| cx43.4 | 0.192 | apoa1b | -0.147 |
| fstl1a | 0.191 | gstt1a | -0.147 |
| isl2a | 0.190 | scp2a | -0.146 |
| cdh6 | 0.189 | suclg1 | -0.144 |
| fgf10b | 0.187 | afp4 | -0.141 |
| tmeff1b | 0.187 | sod1 | -0.141 |
| khdrbs1a | 0.186 | pklr | -0.140 |
| apela | 0.185 | cx32.3 | -0.138 |
| ubc | 0.184 | glud1b | -0.135 |
| tspan7 | 0.183 | mat1a | -0.133 |
| si:dkey-261h17.1 | 0.182 | pgk1 | -0.132 |
| CABZ01075068.1 | 0.182 | sult2st2 | -0.131 |
| wnt2bb | 0.181 | bhmt | -0.131 |
| efna5a | 0.179 | apoa2 | -0.130 |
| emid1 | 0.179 | pgam1a | -0.129 |
| cd9b | 0.177 | rdh1 | -0.128 |
| pcdh19 | 0.177 | suclg2 | -0.128 |
| si:ch211-222l21.1 | 0.177 | tpi1b | -0.127 |
| tgif1 | 0.176 | abat | -0.127 |
| id1 | 0.176 | pnp4b | -0.126 |
| qkia | 0.175 | grhprb | -0.125 |
| cirbpb | 0.175 | tdo2a | -0.125 |
| hnrnpaba | 0.175 | agxtb | -0.125 |
| hmgn6 | 0.175 | mdh1aa | -0.125 |
| znfl2a | 0.175 | apobb.1 | -0.125 |


