Daniocell
ifi35 (pronephros)
interferon-induced protein 35
ZFIN
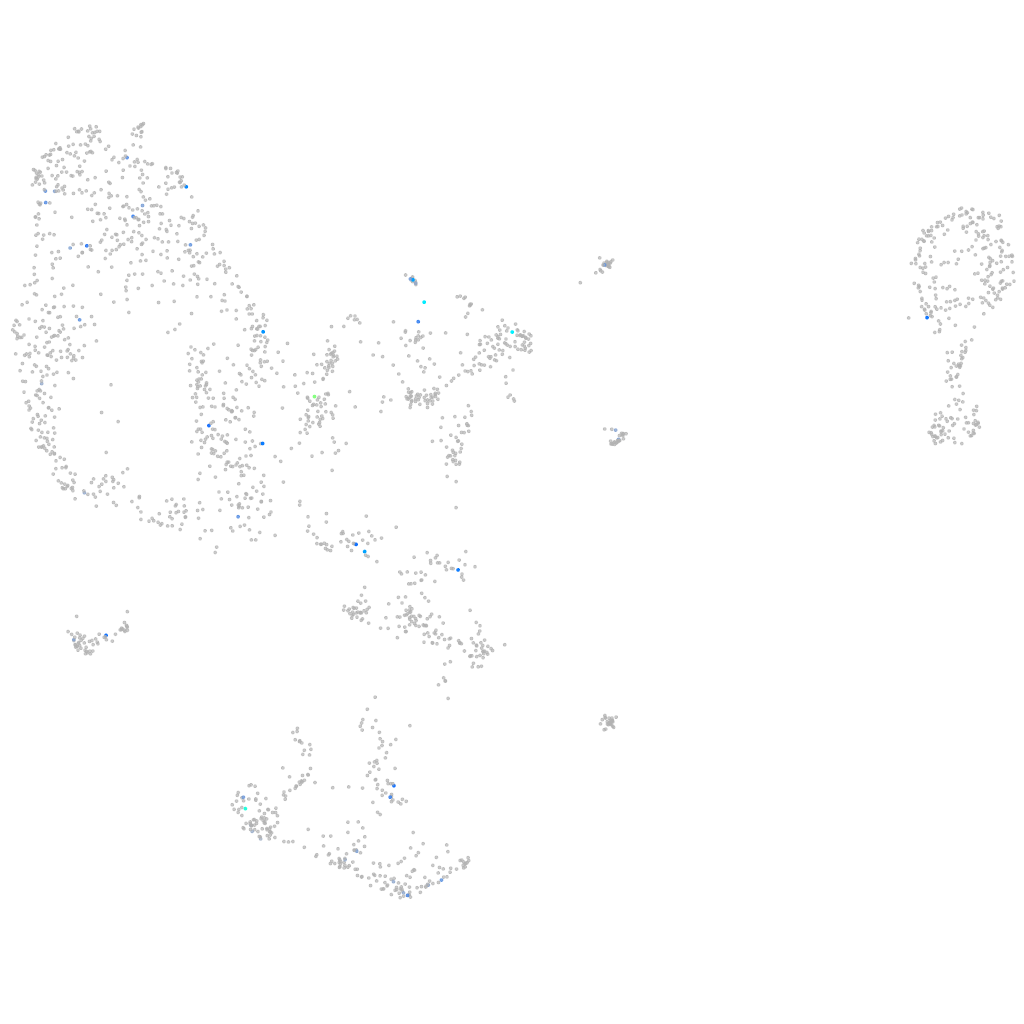
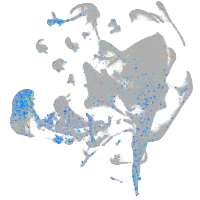
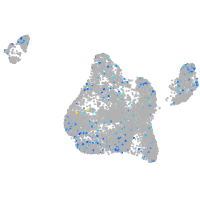
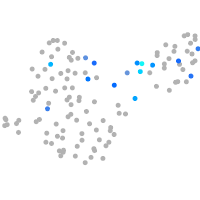
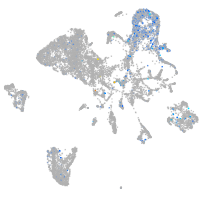
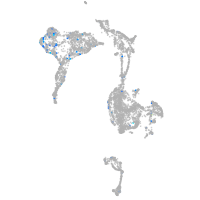
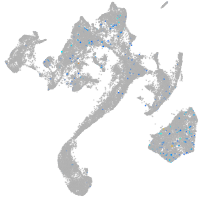
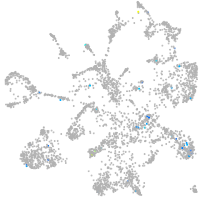
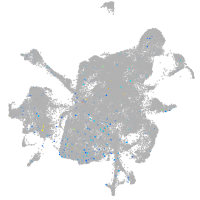
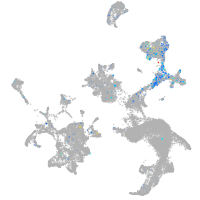
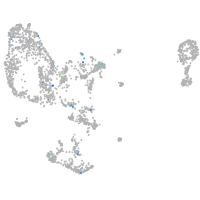
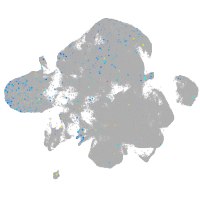
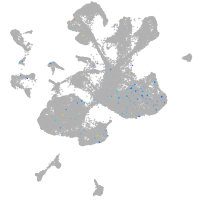
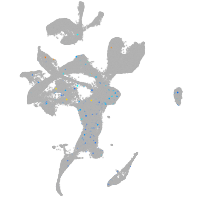
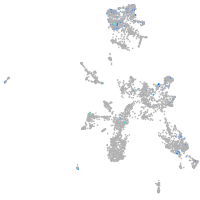
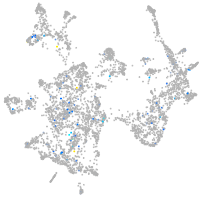
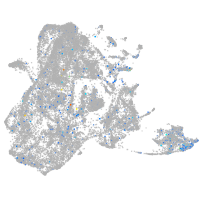
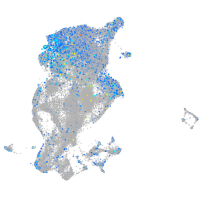
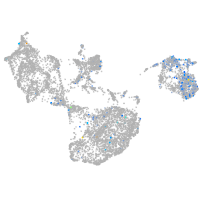
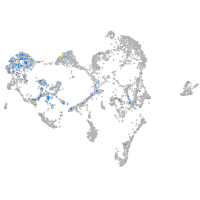
Gene expression UMAP
Display:
Expression
Stage
Other cell groups
all cells
blastomeres
PGCs
endoderm
axial mesoderm
muscle
mural cells /
non-skeletal muscle
mesenchyme
hematopoietic /
vasculature
pronephros
neural
spinal cord / glia
eye
taste / olfactory
otic / lateral line
epidermis
periderm
fin
ionocytes / mucous
pigment cells
Expression by stage/cluster
Correlated gene expression
Positive correlation
Negative correlation
Gene
r
Gene
r
si:ch211-197f20.1
0.352
eif5a2
-0.054
LOC108179692
0.335
eif2s1a
-0.053
si:ch211-188c18.1
0.335
metap2b
-0.052
zgc:114120
0.335
hspb1
-0.051
LOC101886811
0.327
sltm
-0.051
LOC110439526
0.324
hnrnpub
-0.050
CR407550.1
0.307
rps6
-0.049
TCERG1L
0.303
hnrnpl2
-0.049
CR354549.3
0.298
selenoh
-0.048
BX005380.1
0.296
pip4k2ca
-0.048
slc22a17
0.293
tardbpl
-0.048
si:dkey-90m5.4
0.285
nap1l1
-0.048
lhfpl5a
0.285
brd3a
-0.047
piwil1
0.274
rhoaa
-0.047
LOC101882034
0.271
u2af1
-0.047
xkr9
0.267
acot14
-0.047
LOC110440093
0.267
fbl
-0.047
zgc:112433
0.263
ppm1g
-0.046
XLOC-011066
0.253
seta
-0.046
mybpc1
0.250
u2af2a
-0.046
smpd3
0.248
hnrnpm
-0.045
BX901962.1
0.245
si:dkey-56m19.5
-0.045
LOC100535095
0.245
usp10
-0.045
si:dkey-261m9.9.3
0.243
rpsa
-0.045
LOC564237
0.243
rab2a
-0.045
LOC100331080
0.235
igf2bp3
-0.045
chad
0.226
CABZ01115113.1
-0.045
gna14
0.225
nasp
-0.044
slc14a2
0.225
tomm70a
-0.044
arid6
0.224
tpi1b
-0.043
asb16
0.224
hnrnpl
-0.043
jak3
0.224
fubp1
-0.043
si:ch211-195b13.6
0.224
polr2k
-0.042
si:ch211-217k17.8
0.224
yaf2
-0.042
zgc:152658
0.224
eif1ad
-0.042