Daniocell
hs6st1b (blastomeres)
heparan sulfate 6-O-sulfotransferase 1b
ZFIN
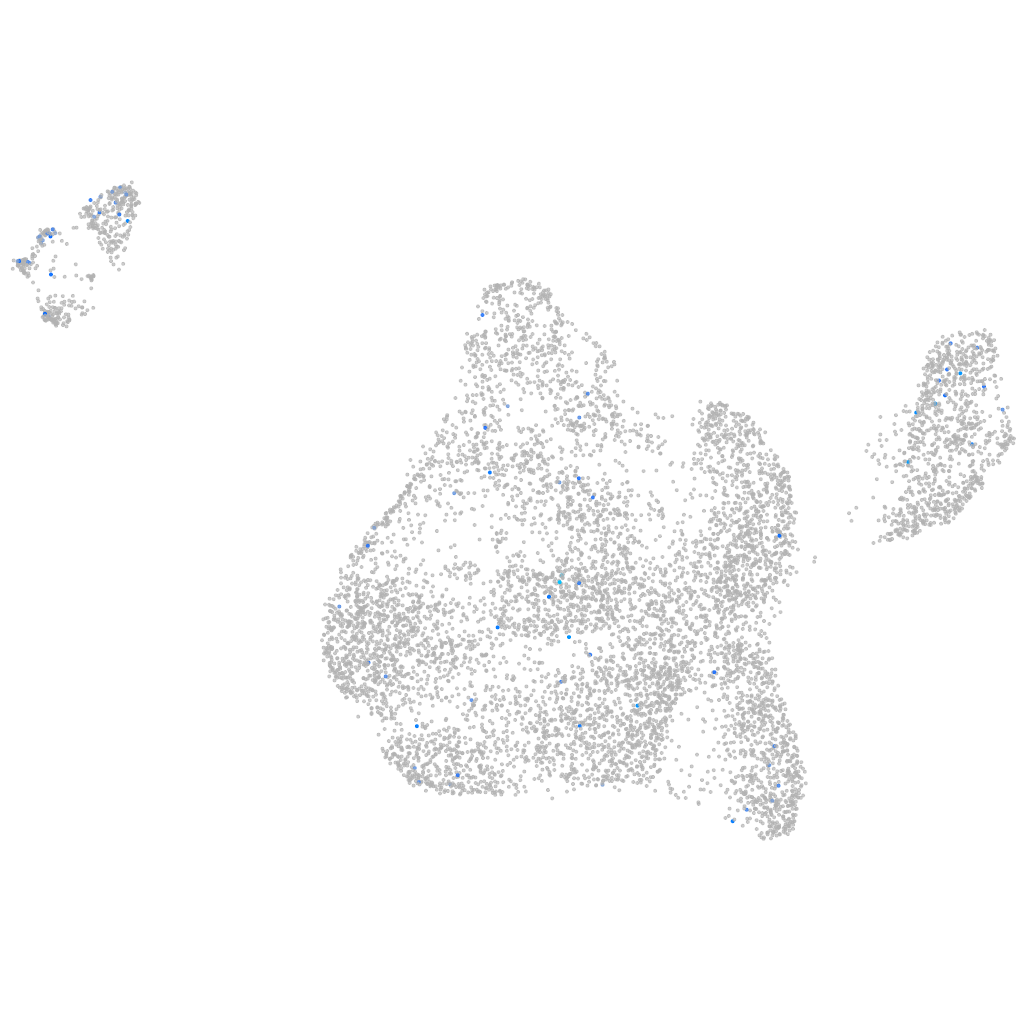
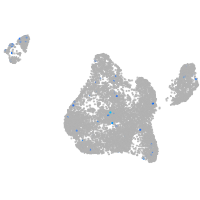
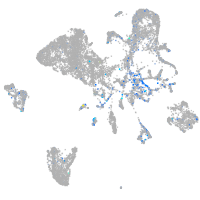
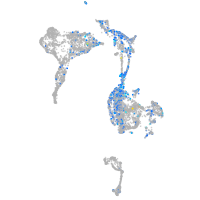
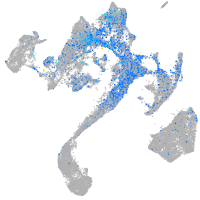
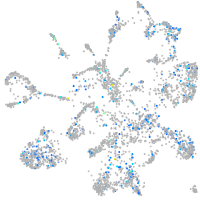
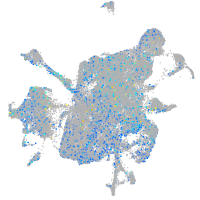
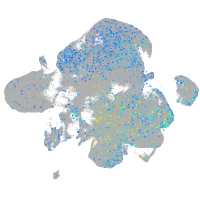
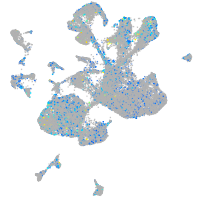
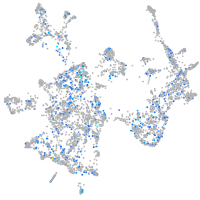
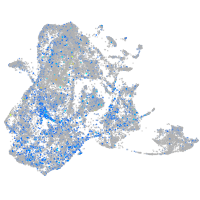
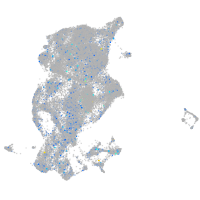
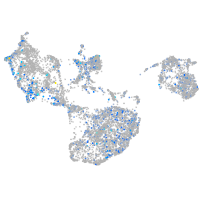
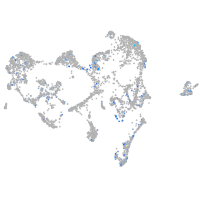
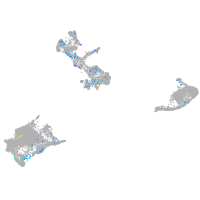
Gene expression UMAP
Display:
Expression
Stage
Other cell groups
all cells
blastomeres
PGCs
endoderm
axial mesoderm
muscle
mural cells /
non-skeletal muscle
mesenchyme
hematopoietic /
vasculature
pronephros
neural
spinal cord / glia
eye
taste / olfactory
otic / lateral line
epidermis
periderm
fin
ionocytes / mucous
pigment cells
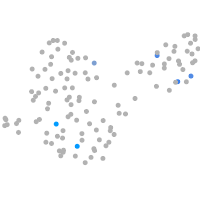
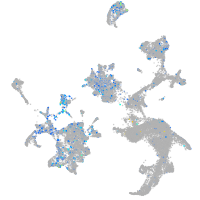
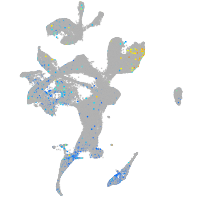
Expression by stage/cluster
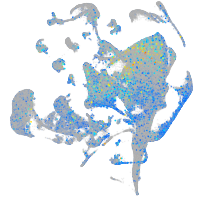
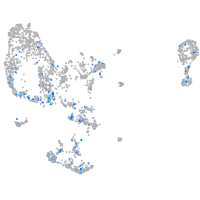
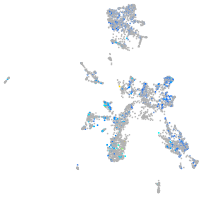
Correlated gene expression
Positive correlation
Negative correlation
Gene
r
Gene
r
SMIM18
0.205
stm
-0.082
LOC110440141
0.176
si:ch73-1a9.3
-0.076
bco2b
0.161
marcksl1b
-0.075
XLOC-013212
0.161
hnrnpa0b
-0.071
XLOC-034214
0.157
hspb1
-0.070
si:ch211-196g2.4
0.152
eef1a1l1
-0.070
CMKLR1
0.147
rps29
-0.065
si:ch73-221f6.3
0.144
rplp0
-0.065
XLOC-010242
0.140
dynll1
-0.063
sema7a
0.127
si:ch211-222l21.1
-0.063
calhm6
0.121
npm1a
-0.062
crygs1
0.120
si:dkey-151g10.6
-0.061
BX547930.4
0.119
aldob
-0.061
kcnab2b
0.115
rps19
-0.060
pimr111
0.114
ybx1
-0.059
CU681836.1
0.114
si:ch211-152c2.3
-0.059
ryr2a
0.113
rpl38
-0.058
tmem163a
0.110
hmgb2a
-0.057
wnt1
0.109
anp32a
-0.057
XLOC-018373
0.109
hmga1a
-0.056
CR927456.1
0.108
asb11
-0.056
opn6a
0.108
NC-002333.4
-0.055
mc2r
0.107
rpl35a
-0.055
LOC110440077
0.105
khdrbs1a
-0.055
si:dkey-163f12.6
0.104
rps12
-0.054
BX470154.1
0.101
rpl36a
-0.054
cpa1
0.101
polr3gla
-0.054
gpr27
0.101
rps16
-0.054
itgae.1
0.100
rps13
-0.054
LOC103910662
0.099
rpl39
-0.053
rprml
0.099
srsf5a
-0.053
LOC101883235
0.099
rplp1
-0.053
LOC100329245
0.097
si:dkey-56m19.5
-0.053
si:dkey-35h6.1
0.097
hmgn6
-0.052
BX908804.3
0.096
cox7c
-0.052