Daniocell
hmgn6 (ionocytes / mucous-producing)
high mobility group nucleosome binding domain 6
ZFIN
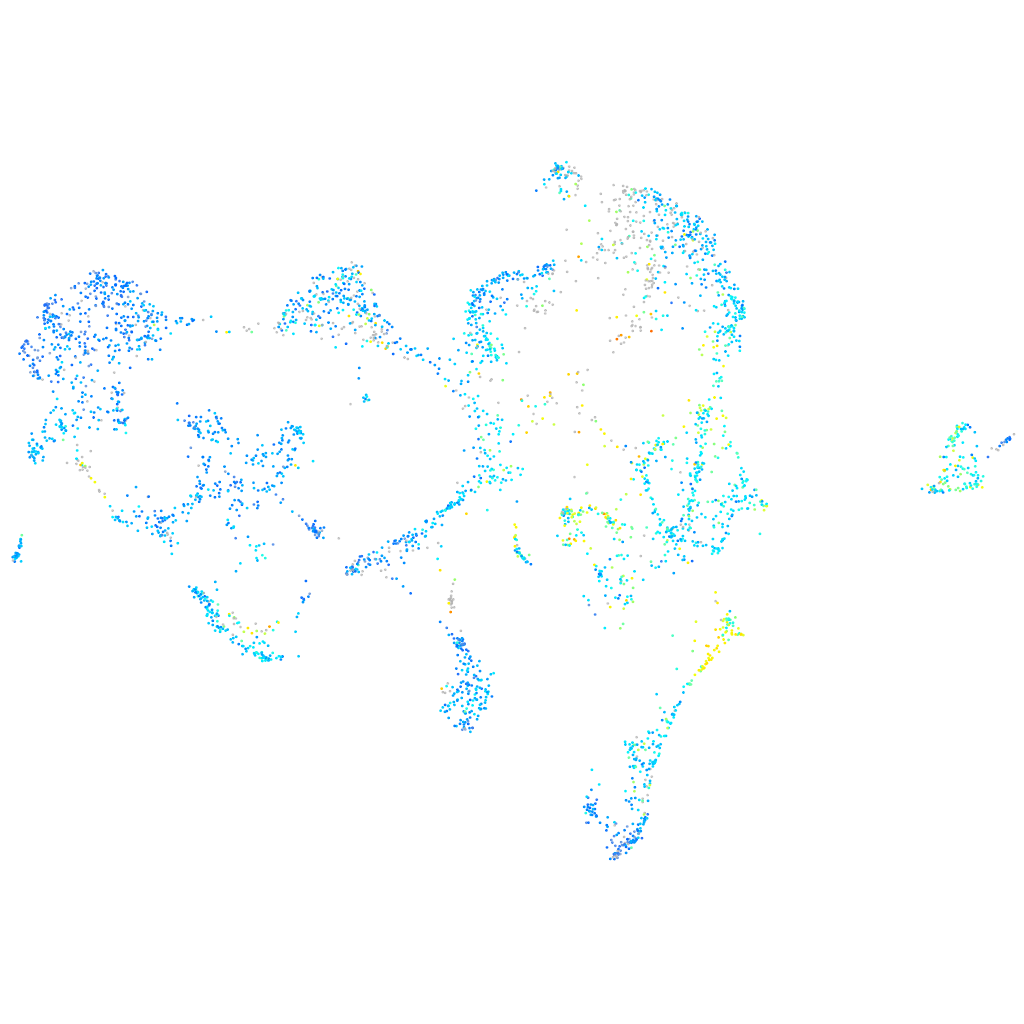
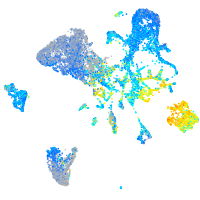
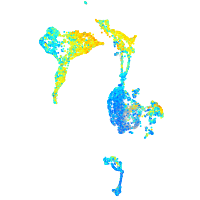
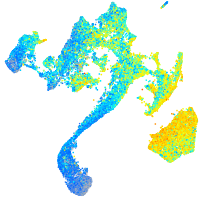
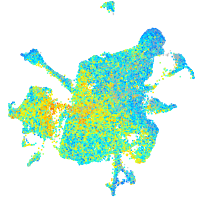
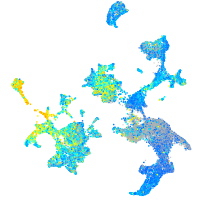
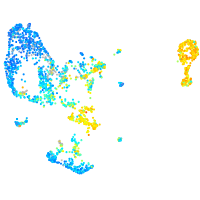
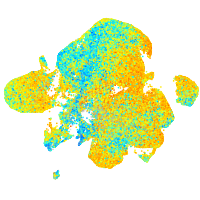
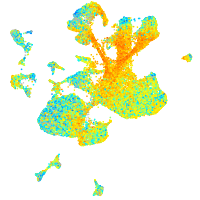
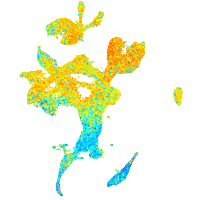
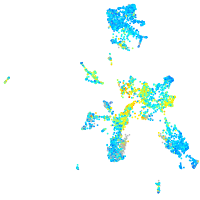
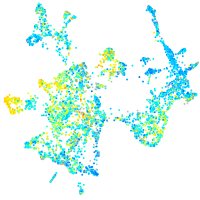
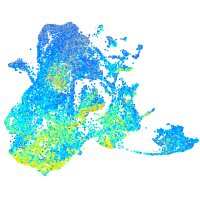
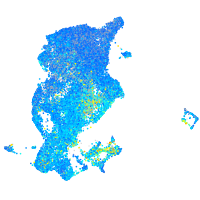
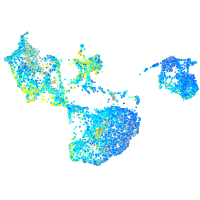
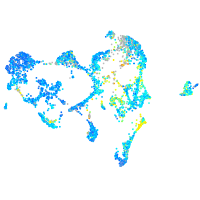
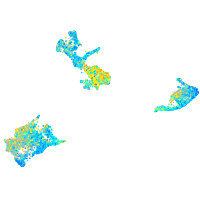
Gene expression UMAP
Display:
Expression
Stage
Other cell groups
all cells
blastomeres
PGCs
endoderm
axial mesoderm
muscle
mural cells /
non-skeletal muscle
mesenchyme
hematopoietic /
vasculature
pronephros
neural
spinal cord / glia
eye
taste / olfactory
otic / lateral line
epidermis
periderm
fin
ionocytes / mucous
pigment cells
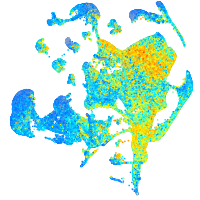
Expression by stage/cluster
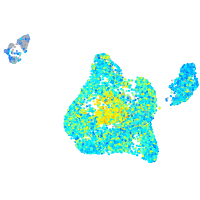
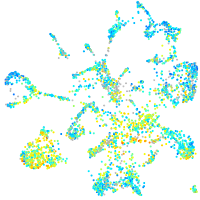
Correlated gene expression
Positive correlation
Negative correlation
Gene
r
Gene
r
h2afvb
0.503
selenow1
-0.306
hmga1a
0.479
aldob
-0.283
h3f3d
0.478
si:dkey-248g15.3
-0.267
hmgn2
0.478
abcb5
-0.260
si:ch211-222l21.1
0.469
krt5
-0.257
hmgb2b
0.463
tdh
-0.256
khdrbs1a
0.460
krt17
-0.240
h3f3a
0.458
rplp2
-0.238
hnrnpaba
0.455
wu:fa03e10
-0.232
snrpf
0.443
krtt1c19e
-0.229
sub1a
0.433
BX000438.2
-0.227
ptmab
0.428
si:dkey-247k7.2
-0.218
hmgn7
0.425
si:ch211-207n23.2
-0.216
snrpd2
0.424
krt91
-0.215
snrpe
0.422
si:dkey-193p11.2
-0.215
si:ch73-281n10.2
0.418
icn2
-0.215
ddx39ab
0.417
scel
-0.212
hnrnpabb
0.414
ak1
-0.211
hdac1
0.412
si:dkey-33i11.9
-0.205
hmgb2a
0.412
LOC110438378
-0.204
sumo3a
0.409
pnp5a
-0.204
si:ch211-288g17.3
0.408
mgst1.2
-0.203
cirbpb
0.406
si:ch211-105c13.3
-0.203
snrpd1
0.402
epdl1
-0.203
snrpb
0.398
si:dkey-33c14.3
-0.203
ilf2
0.396
b2ml
-0.201
seta
0.395
si:dkeyp-51b9.3
-0.201
snrpg
0.394
ier2b
-0.201
alyref
0.390
apodb
-0.200
setb
0.390
abca12
-0.200
lsm7
0.389
fbp1a
-0.198
hnrnpa0b
0.389
zgc:110333
-0.198
apex1
0.387
DSG2
-0.196
si:ch73-1a9.3
0.382
itm2bb
-0.195
marcksb
0.381
zgc:111983
-0.192