
high mobility group nucleosomal binding domain 3
ZFIN 
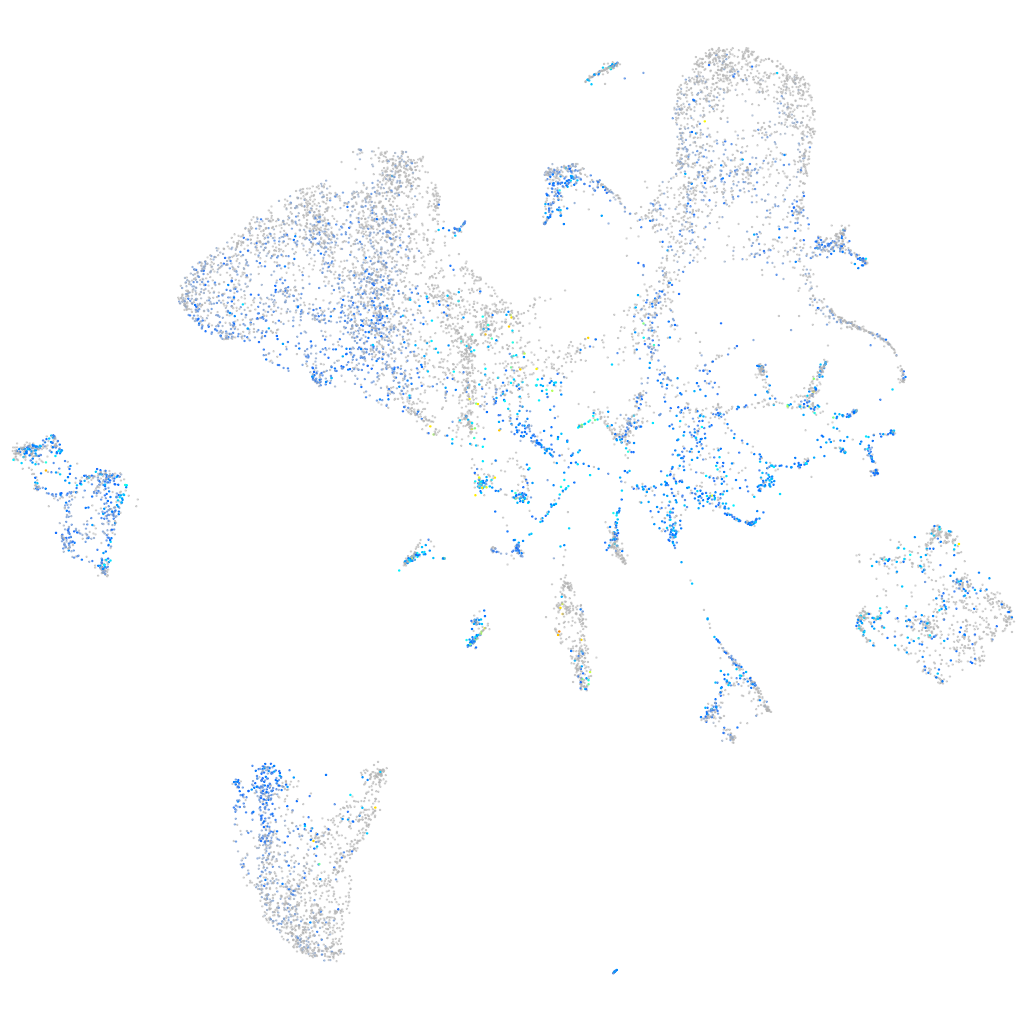
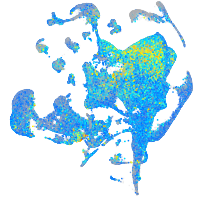
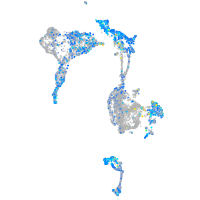
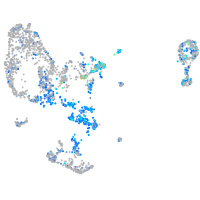
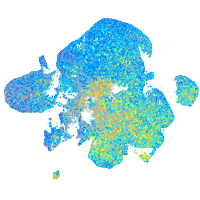
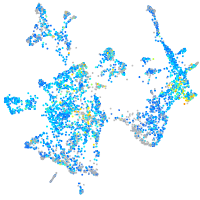
Gene expression UMAP


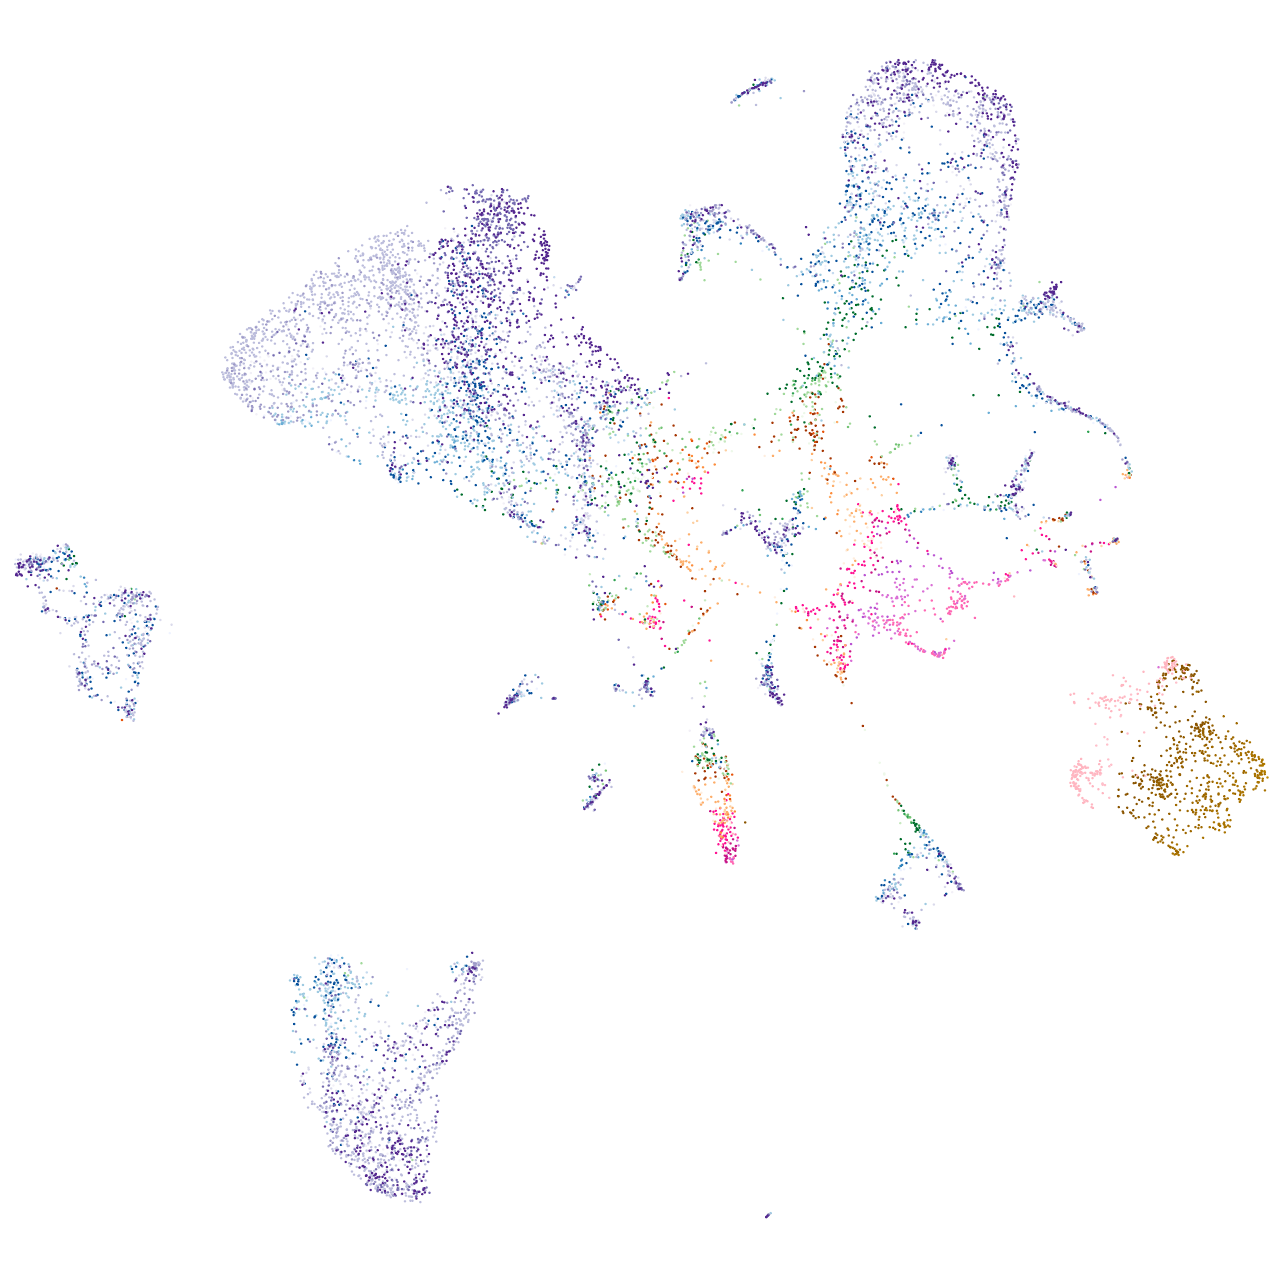


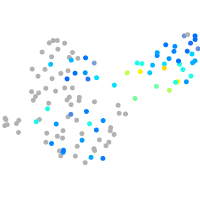


Expression by stage/cluster
Correlated gene expression
| Positive correlation | Negative correlation | ||
| Gene | r | Gene | r |
| h3f3a | 0.321 | gapdh | -0.270 |
| h2afvb | 0.317 | gamt | -0.242 |
| hnrnpa0l | 0.312 | apoa4b.1 | -0.224 |
| ptmab | 0.309 | gatm | -0.222 |
| hmgn2 | 0.307 | fbp1b | -0.221 |
| h3f3d | 0.304 | pnp4b | -0.219 |
| h3f3c | 0.298 | apoc2 | -0.219 |
| si:ch1073-429i10.3.1 | 0.298 | aldob | -0.214 |
| ywhabl | 0.290 | gpx4a | -0.213 |
| hnrnpaba | 0.288 | apobb.1 | -0.210 |
| oaz1b | 0.286 | ahcy | -0.209 |
| hmgn6 | 0.285 | glud1b | -0.209 |
| cirbpb | 0.277 | rbp2a | -0.206 |
| vdac1 | 0.271 | ucp1 | -0.202 |
| lsm7 | 0.270 | cyp2n13 | -0.199 |
| sumo3a | 0.270 | afp4 | -0.198 |
| khdrbs1a | 0.270 | dhrs9 | -0.197 |
| h2afva | 0.269 | cox7a1 | -0.197 |
| hmgn7 | 0.269 | scp2a | -0.196 |
| si:ch211-222l21.1 | 0.269 | rdh1 | -0.195 |
| sumo2b | 0.268 | abat | -0.190 |
| ptmaa | 0.265 | pck1 | -0.188 |
| ubc | 0.265 | pla2g12b | -0.187 |
| ran | 0.263 | gstt1a | -0.185 |
| si:ch73-1a9.3 | 0.260 | sult2st2 | -0.185 |
| tubb4b | 0.260 | ugt5b4 | -0.184 |
| ywhaz | 0.260 | agmo | -0.183 |
| hnrnpa0b | 0.256 | chpt1 | -0.183 |
| sub1a | 0.254 | apoa1b | -0.182 |
| calm3b | 0.254 | faxdc2 | -0.182 |
| hmgb2a | 0.253 | dgat2 | -0.180 |
| hmgb3a | 0.253 | g6pca.2 | -0.179 |
| h2afx1 | 0.252 | cx32.3 | -0.178 |
| psma5 | 0.251 | etnppl | -0.172 |
| tuba8l4 | 0.250 | cyp7a1 | -0.172 |