Daniocell
hmga2 (blastomeres)
high mobility group AT-hook 2
ZFIN
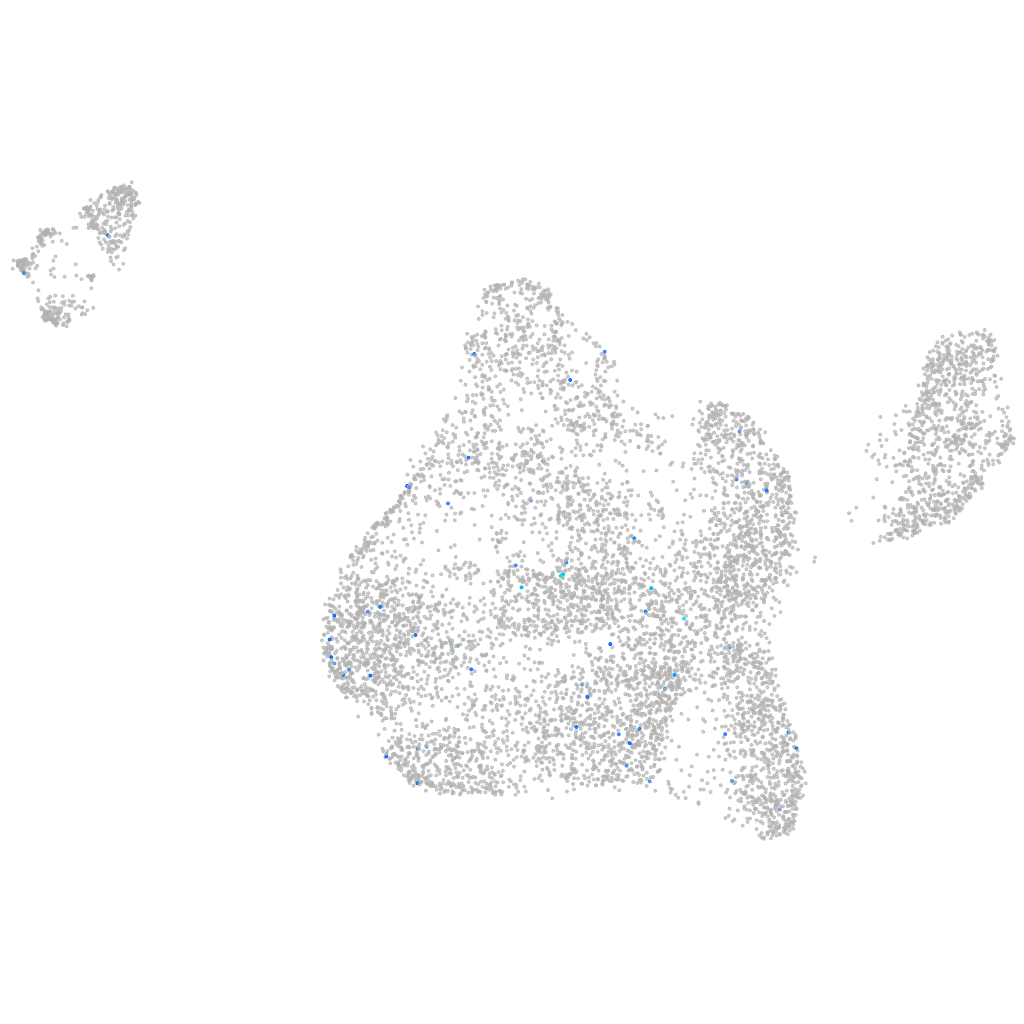
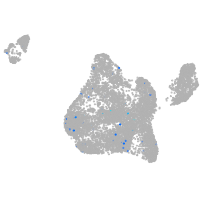
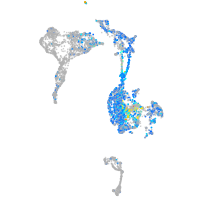
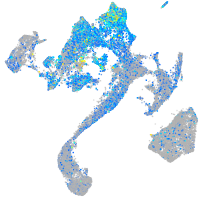
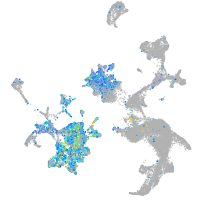
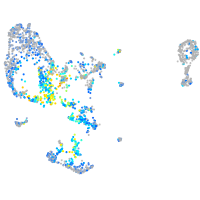
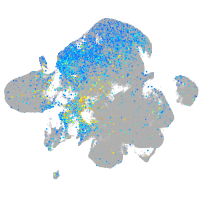
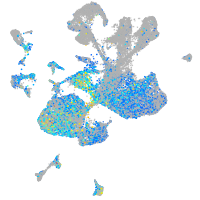
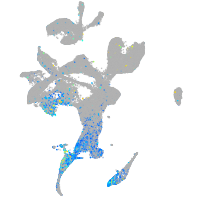
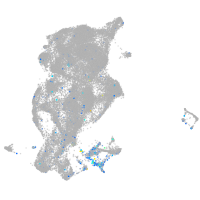
Gene expression UMAP
Display:
Expression
Stage
Other cell groups
all cells
blastomeres
PGCs
endoderm
axial mesoderm
muscle
mural cells /
non-skeletal muscle
mesenchyme
hematopoietic /
vasculature
pronephros
neural
spinal cord / glia
eye
taste / olfactory
otic / lateral line
epidermis
periderm
fin
ionocytes / mucous
pigment cells
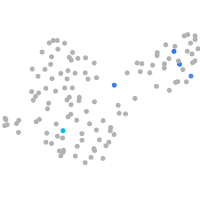
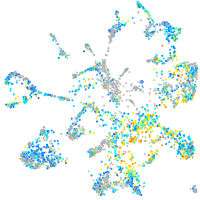
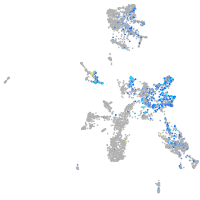
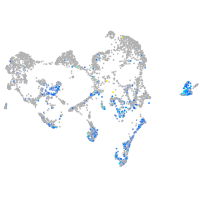
Expression by stage/cluster
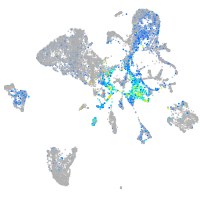
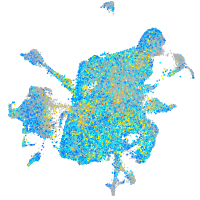
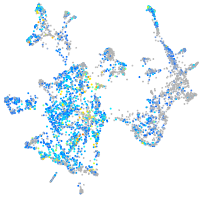
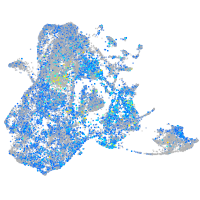
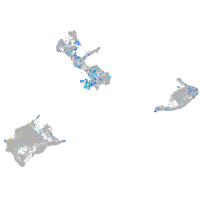
Correlated gene expression
Positive correlation
Negative correlation
Gene
r
Gene
r
gal3st1b
0.194
erh
-0.040
CT583651.1
0.190
dnajc1
-0.037
LOC100535061
0.184
waca
-0.036
LOC108184035
0.183
kdm4b
-0.035
mep1a.1
0.175
ccnt2b
-0.034
si:dkey-42l23.2
0.164
blf
-0.034
elf3
0.146
si:ch211-173m16.2
-0.034
LOC101886724
0.142
acp5a
-0.033
pik3cb
0.139
si:dkey-33c12.4
-0.033
BX842701.1
0.134
sec61b
-0.033
LOC103910010
0.130
tbpl1
-0.033
LOC101885655
0.125
spink2.1
-0.032
BX548078.1
0.121
mob1bb
-0.031
XLOC-039758
0.120
desi2
-0.031
FAT4
0.117
glulb
-0.031
fanca
0.115
zgc:173742
-0.031
tmod1
0.111
rcor1
-0.031
si:ch211-266k8.6
0.110
spns1
-0.031
dnase1l1l
0.107
ndrg1a
-0.030
acsbg1
0.106
fopnl
-0.030
apbb1ip
0.104
eny2
-0.030
afp4
0.100
XLOC-013632
-0.030
si:ch211-153b23.4
0.097
npc2
-0.029
XLOC-041269
0.096
ube2g1a
-0.029
dnase1l4.2
0.096
sub1b
-0.029
CR759845.3
0.095
exd2
-0.029
si:ch211-272b8.6
0.094
fam117ab
-0.029
XLOC-008507
0.094
oclna
-0.029
crygm2d1
0.094
si:dkey-42i9.4
-0.029
XLOC-018968
0.094
nanog
-0.029
mlip
0.092
ccdc43
-0.029
tph2
0.092
zgc:112356
-0.029
sema4aa
0.092
cnot8
-0.029
stc2a
0.091
lsm8
-0.029
ccl34a.4
0.090
brd3b
-0.029