Daniocell
hic1l (mural cells / non-skeletal muscle)
hypermethylated in cancer 1 like
ZFIN
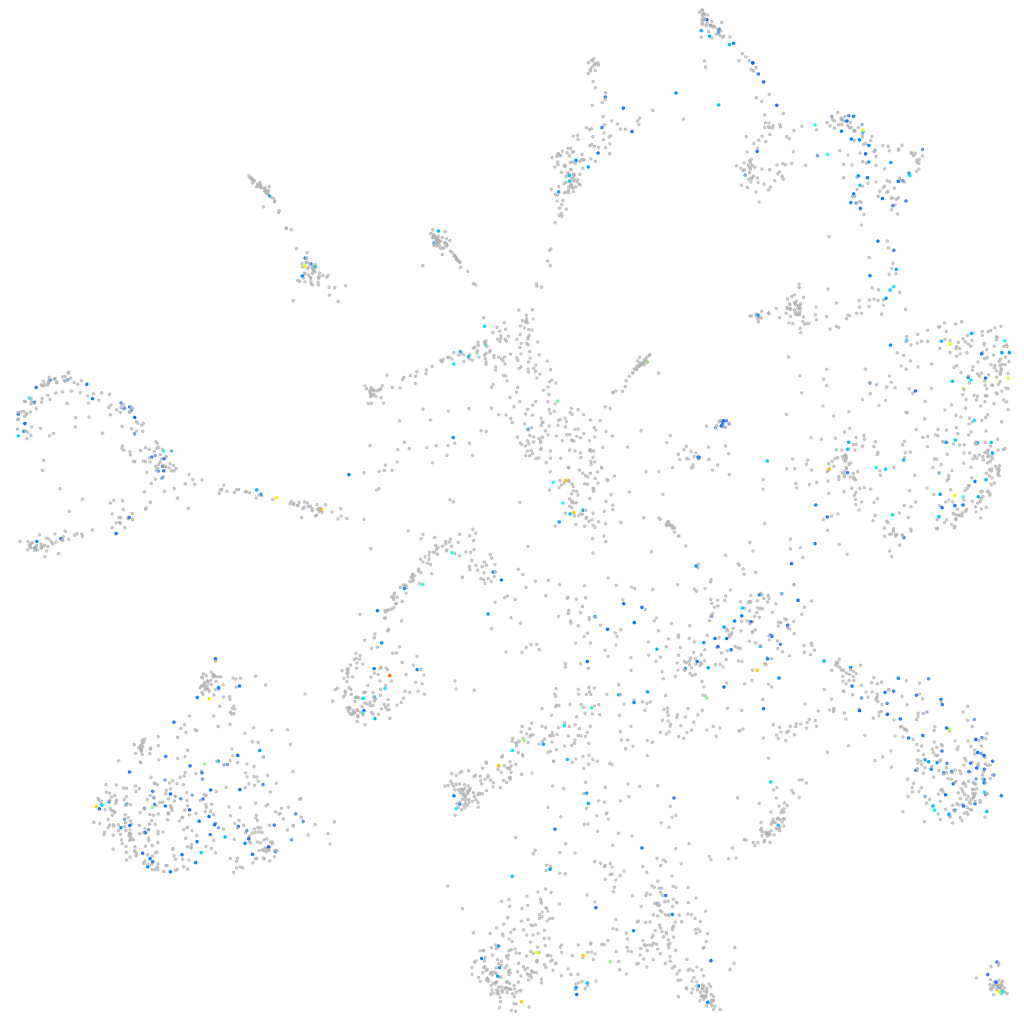
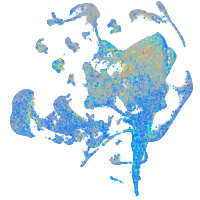
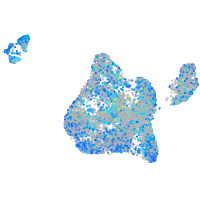
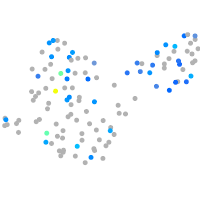
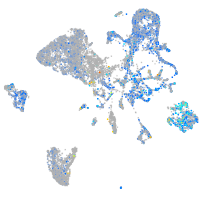
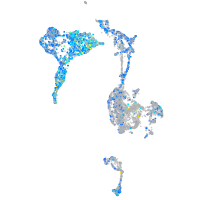
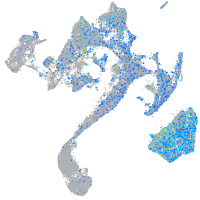
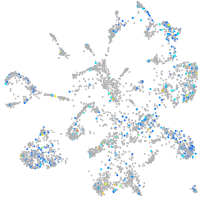
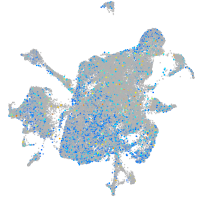
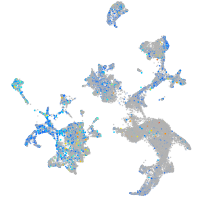
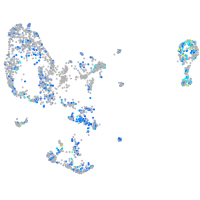
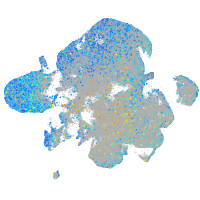
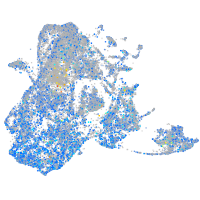
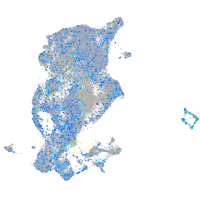
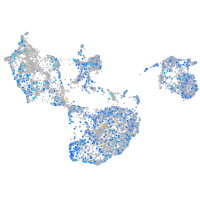
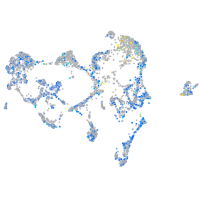
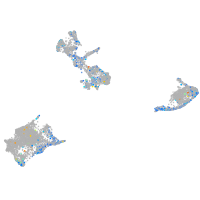
Gene expression UMAP
Display:
Expression
Stage
Other cell groups
all cells
blastomeres
PGCs
endoderm
axial mesoderm
muscle
mural cells /
non-skeletal muscle
mesenchyme
hematopoietic /
vasculature
pronephros
neural
spinal cord / glia
eye
taste / olfactory
otic / lateral line
epidermis
periderm
fin
ionocytes / mucous
pigment cells
Expression by stage/cluster
Correlated gene expression
Positive correlation
Negative correlation
Gene
r
Gene
r
BX571803.1
0.116
rps29
-0.088
si:dkey-250k10.1
0.111
rpl29
-0.065
tbc1d10c
0.111
rpl38
-0.065
npffr1l1
0.109
apoa2
-0.063
si:ch211-226f6.1
0.109
acta1b
-0.060
tfcp2l1
0.107
tagln
-0.060
CABZ01088367.1
0.106
acta2
-0.057
grid2ipa
0.105
pvalb2
-0.055
BX510940.1
0.105
mylkb
-0.054
BX510934.2
0.104
tpm1
-0.054
nufip2
0.102
rpl37
-0.054
LOC110437726
0.102
myh11a
-0.052
LOC100536462
0.099
apoa1b
-0.052
zmp:0000001138
0.098
rplp1
-0.051
elovl6l
0.098
rps28
-0.050
dusp3b
0.096
kng1
-0.050
CR388190.1
0.096
rpl39
-0.049
sema3ga
0.095
hbbe1.1
-0.049
XLOC-021254
0.095
pcolce2b
-0.048
BX546503.1
0.095
pvalb1
-0.048
ppp2r5ca
0.094
il13ra2
-0.047
ltb4r2b
0.093
si:dkey-151g10.6
-0.047
odam
0.093
myhz2
-0.047
si:dkey-192d15.2
0.093
zgc:110699
-0.047
BX284666.1
0.093
myl9a
-0.047
XLOC-007224
0.092
lmod1b
-0.046
homeza
0.092
CU571069.1
-0.046
mipa
0.092
tspan15
-0.046
slc35d2
0.092
pgm5
-0.045
AL845295.1
0.092
BX322618.1
-0.045
si:ch211-261n11.5
0.091
fsta
-0.044
midn
0.090
gngt2b
-0.044
cadm1a
0.090
tpm2
-0.044
lingo1b
0.090
apoc1
-0.044
BX005351.1
0.089
si:dkey-57k2.6
-0.044