Daniocell
hgsnat (blastomeres)
heparan-alpha-glucosaminide N-acetyltransferase
ZFIN
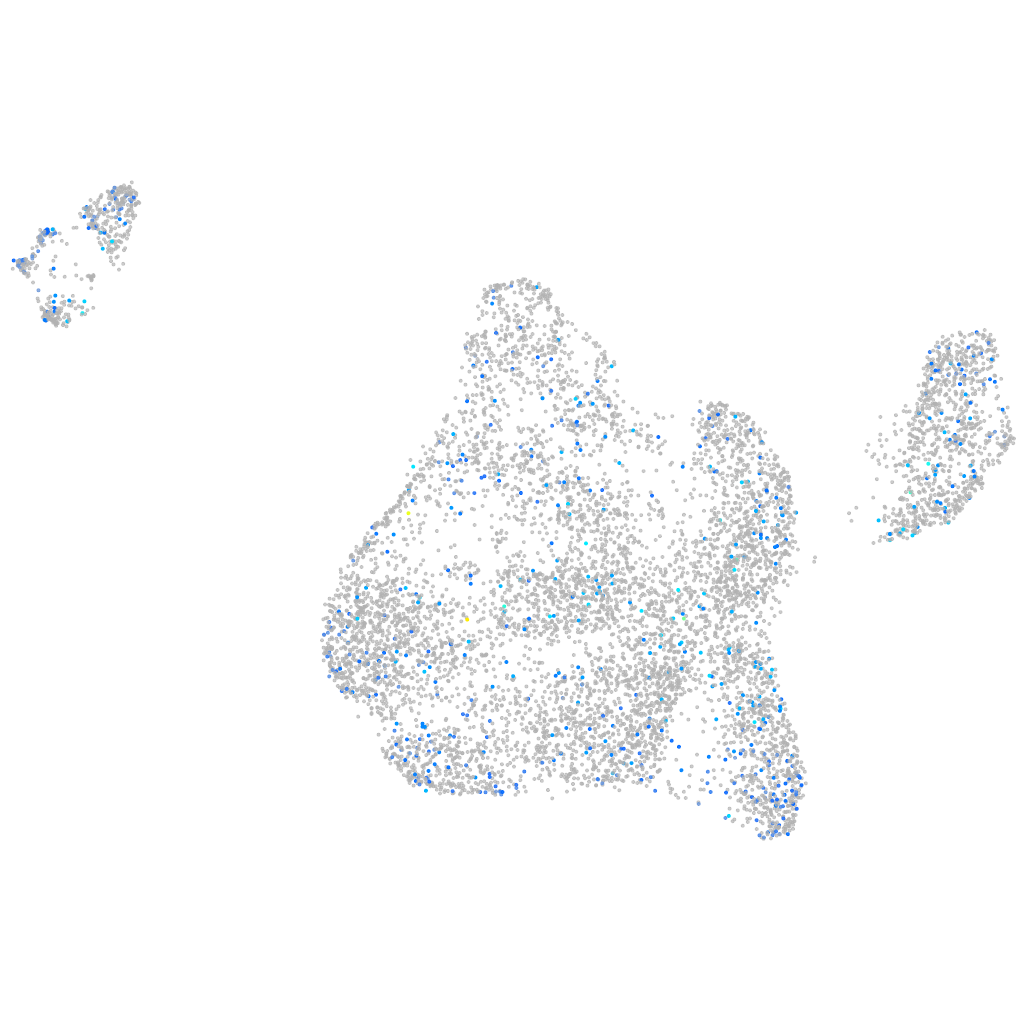
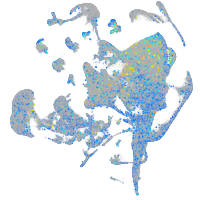
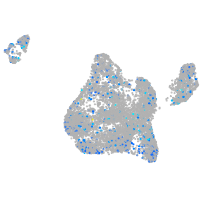
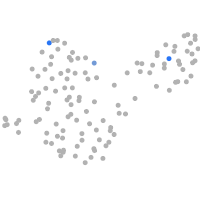
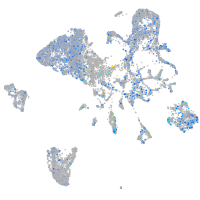
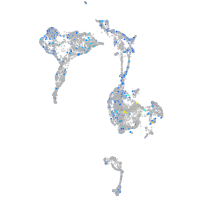
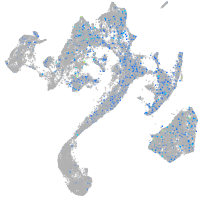
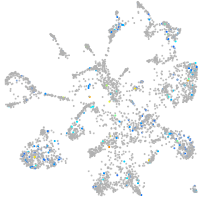
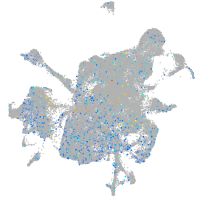
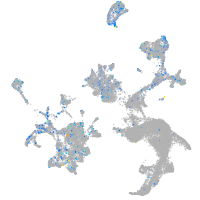
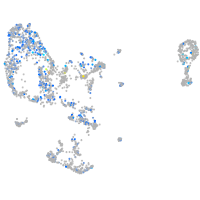
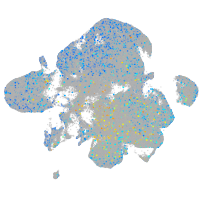
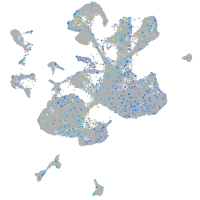
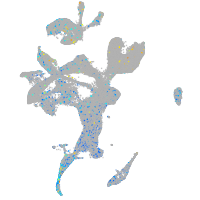
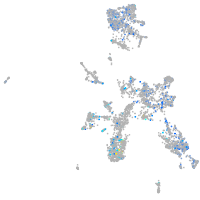
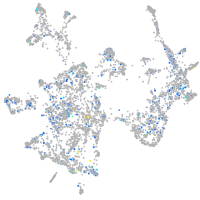
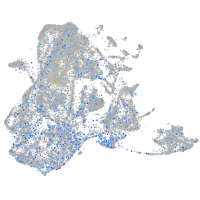
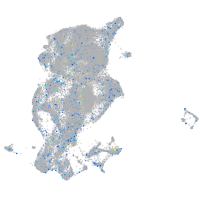
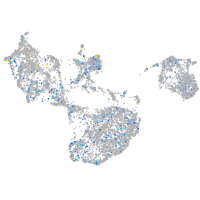
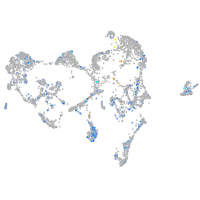
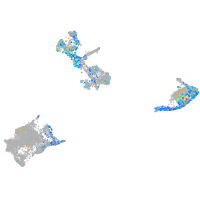
Gene expression UMAP
Display:
Expression
Stage
Other cell groups
all cells
blastomeres
PGCs
endoderm
axial mesoderm
muscle
mural cells /
non-skeletal muscle
mesenchyme
hematopoietic /
vasculature
pronephros
neural
spinal cord / glia
eye
taste / olfactory
otic / lateral line
epidermis
periderm
fin
ionocytes / mucous
pigment cells
Expression by stage/cluster
Correlated gene expression
Positive correlation
Negative correlation
Gene
r
Gene
r
si:dkey-28d5.8
0.084
hspb1
-0.056
LOC103909969
0.083
hnrnpa0b
-0.054
CR933812.1
0.079
rpl13a
-0.052
CR382300.1
0.076
si:ch211-222l21.1
-0.051
fshr
0.075
rpl26
-0.051
heg1
0.071
rplp2l
-0.050
CU469530.2
0.069
marcksl1b
-0.050
opn1mw1
0.069
polr3gla
-0.047
cacna1c
0.068
rpl7
-0.046
XLOC-005140
0.067
hmgn6
-0.046
stk24a
0.066
rpl21
-0.045
rftn2
0.065
tubb2b
-0.044
si:ch1073-181h11.2
0.065
apoeb
-0.044
LOC100535061
0.064
si:ch211-152c2.3
-0.042
pimr175
0.064
emg1
-0.042
muc13a
0.063
srsf3a
-0.041
kcna2b
0.063
khk
-0.040
si:ch211-125e6.14
0.062
si:ch73-1a9.3
-0.040
LOC108179291
0.061
ewsr1a
-0.039
gripap1
0.061
coa6
-0.039
apoa1a
0.061
eef1a1l1
-0.039
si:ch211-111e20.1
0.061
CR383676.1
-0.038
LOC110438614
0.061
rpl7a
-0.037
tex2
0.060
hnrnph1l
-0.037
drd6b
0.060
rps29
-0.037
slc29a4
0.059
snrpf
-0.036
h2af1al
0.059
rpl27
-0.036
hoxd11a
0.059
rps26l
-0.036
si:dkey-26c10.5
0.059
ybx1
-0.035
zgc:198241
0.058
rps23
-0.035
islr2
0.058
hmgn2
-0.035
gltpb
0.058
aldob
-0.034
XLOC-024343
0.058
srsf5a
-0.034
h1m
0.058
psmb7
-0.034
BX571945.2
0.058
rps15a
-0.034