Daniocell
hcfc2 (ionocytes / mucous-producing)
host cell factor C2
ZFIN
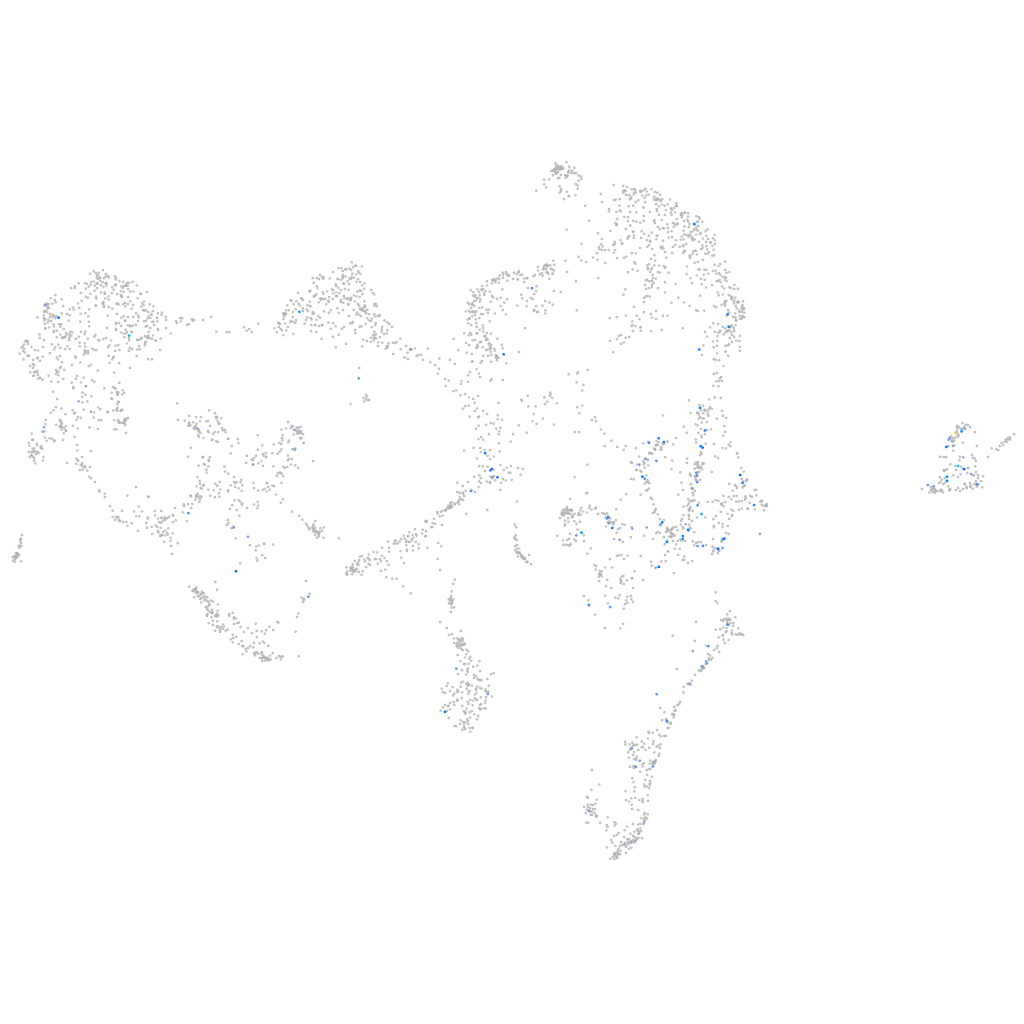
Gene expression UMAP
Display:
Expression
Stage
Other cell groups
all cells
blastomeres
PGCs
endoderm
axial mesoderm
muscle
mural cells /
non-skeletal muscle
mesenchyme
hematopoietic /
vasculature
pronephros
neural
spinal cord / glia
eye
taste / olfactory
otic / lateral line
epidermis
periderm
fin
ionocytes / mucous
pigment cells
Expression by stage/cluster
Correlated gene expression
Positive correlation
Negative correlation
Gene
r
Gene
r
CSDC2 (1 of many)
0.293
BX000438.2
-0.113
arg1
0.279
si:ch211-195b11.3
-0.096
LOC563477
0.250
zgc:153284
-0.093
fam198b
0.246
selenow1
-0.092
CABZ01056843.1
0.244
si:dkey-193p11.2
-0.092
trim110
0.240
si:dkey-248g15.3
-0.089
mef2ab
0.230
soul2
-0.086
plppr5a
0.225
zgc:110333
-0.086
LOC100535130
0.224
krt4
-0.085
anos1b
0.220
si:dkey-247k7.2
-0.083
RTKN
0.213
aldob
-0.082
unc5b
0.209
zgc:193505
-0.081
cpne2
0.207
wu:fb18f06
-0.081
epha6
0.200
spint2
-0.081
CABZ01109081.1
0.197
abcb5
-0.080
zgc:153031
0.193
atp1b1b
-0.077
ablim1a
0.189
fbp1a
-0.076
kcnq5b
0.188
tdh
-0.075
dut
0.186
mgst1.2
-0.074
lbr
0.185
tob1b
-0.073
si:dkeyp-69c1.9
0.181
cldnh
-0.073
smc1al
0.179
ppl
-0.072
hmgb1b
0.178
si:dkey-184p9.7
-0.072
LOC100002923
0.177
LOC799574
-0.070
si:ch211-222l21.1
0.176
nfe2l2a
-0.070
mki67
0.174
gsto2
-0.069
hmgb2b
0.174
ak1
-0.068
ephb2b
0.174
apodb
-0.068
sumo3b
0.173
ppdpfb
-0.068
si:ch211-288g17.3
0.173
si:ch73-359m17.9
-0.068
irx1b
0.172
gabarapl2
-0.068
ccna2
0.170
rnf128a
-0.067
asip2b
0.170
ifi45
-0.067
dia1b
0.170
icn
-0.067
TTC28
0.168
selenow2b
-0.067