Daniocell
hao1 (epidermis)
hydroxyacid oxidase (glycolate oxidase) 1
ZFIN
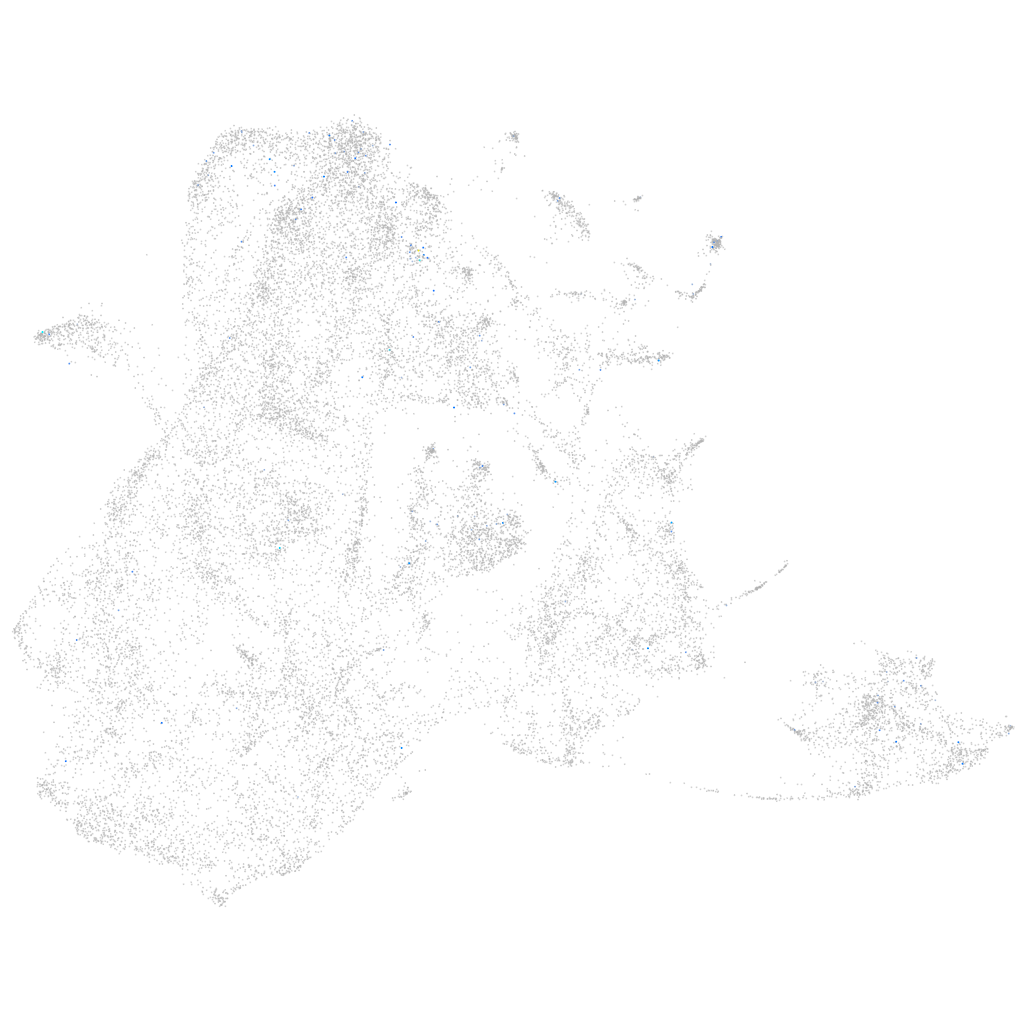
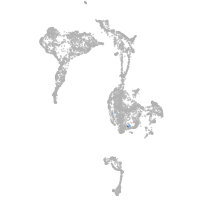
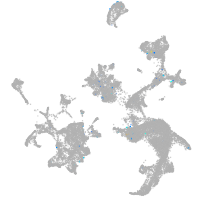
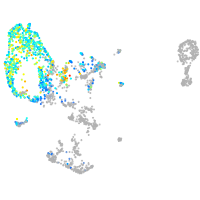
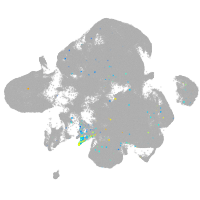
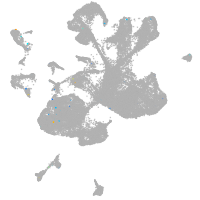
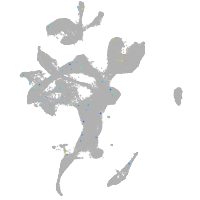
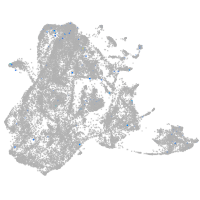
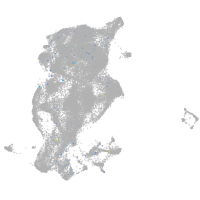
Gene expression UMAP
Display:
Expression
Stage
Other cell groups
all cells
blastomeres
PGCs
endoderm
axial mesoderm
muscle
mural cells /
non-skeletal muscle
mesenchyme
hematopoietic /
vasculature
pronephros
neural
spinal cord / glia
eye
taste / olfactory
otic / lateral line
epidermis
periderm
fin
ionocytes / mucous
pigment cells
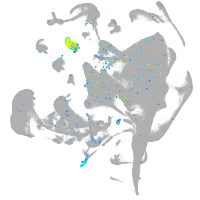
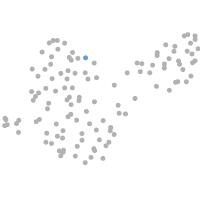
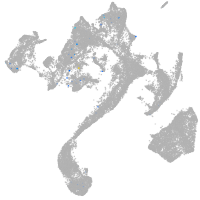
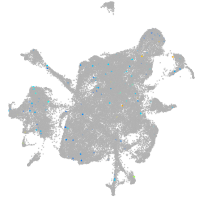
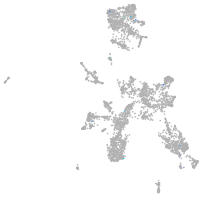
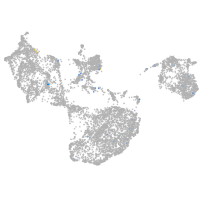
Expression by stage/cluster
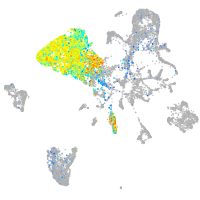
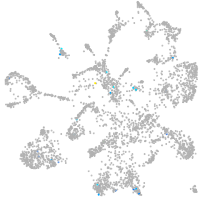
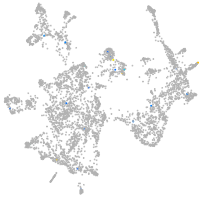
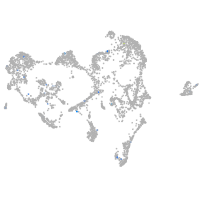
Correlated gene expression
Positive correlation
Negative correlation
Gene
r
Gene
r
LOC100002202
0.205
si:ch211-222l21.1
-0.043
cfhl3
0.203
hmga1a
-0.039
si:ch211-114l13.12
0.184
hmgn6
-0.036
si:dkey-193b15.5
0.182
ptmab
-0.034
marco
0.154
hp1bp3
-0.034
LOC103911531.1
0.153
asph
-0.033
klhdc7a
0.130
cbx5
-0.032
serpina1
0.112
snrpb
-0.031
si:ch211-229d2.5
0.110
si:ch73-281n10.2
-0.031
rbp2b
0.109
si:ch73-1a9.3
-0.031
LOC110438494
0.108
syncrip
-0.031
LOC110440217
0.106
si:ch73-46j18.5
-0.030
fabp10a
0.105
crtap
-0.030
LOC110439448
0.104
hmgb2b
-0.030
c3a.5
0.104
ddx39ab
-0.030
gltpd2
0.100
fkbp9
-0.030
BX322792.1
0.099
rcn1
-0.029
XLOC-002521
0.098
gnb1b
-0.029
apoa1b
0.098
seta
-0.029
apoa2
0.094
apex1
-0.029
si:ch211-147m6.2
0.094
sub1a
-0.028
si:dkey-205h13.2
0.092
tpm4a
-0.028
ccdc9b
0.092
ptges3b
-0.027
CABZ01056321.1
0.089
arpc5a
-0.027
st3gal1l
0.088
mtdha
-0.026
si:ch211-196f2.6
0.087
hnrnph1l
-0.026
klhl40b
0.086
ywhaqa
-0.026
tfeb
0.085
hmgn7
-0.026
fabp1b.2
0.084
rcn3
-0.026
LOC110439420
0.084
hnrnpaba
-0.026
tfa
0.083
fkbp1aa
-0.026
amy2a
0.082
dad1
-0.026
si:dkeyp-92c9.4
0.082
zgc:153675
-0.025
ambp
0.081
tia1l
-0.025
kcng2
0.081
srsf3b
-0.025