Daniocell
hacl1 (mesenchyme)
2-hydroxyacyl-CoA lyase 1
ZFIN
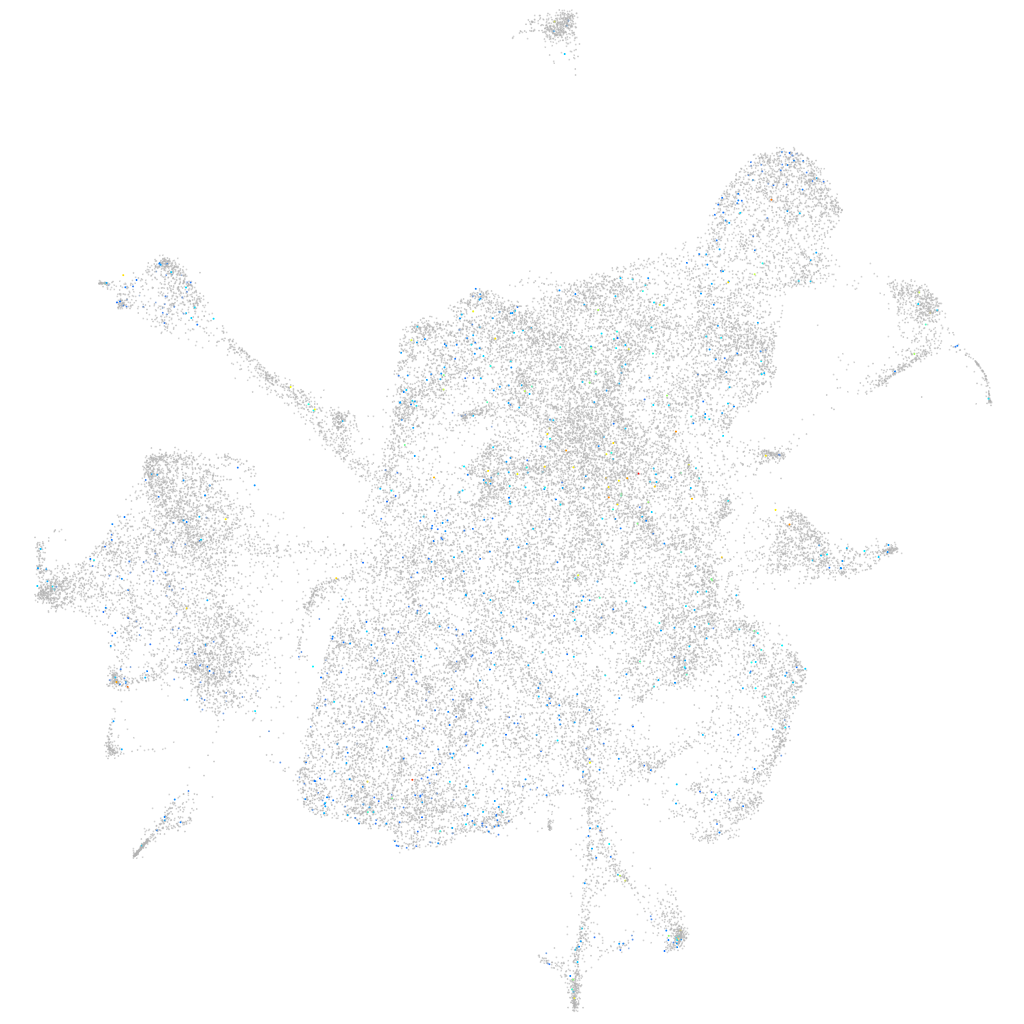
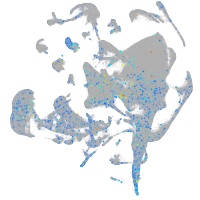
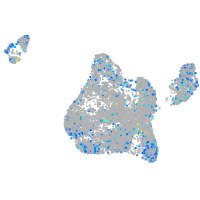
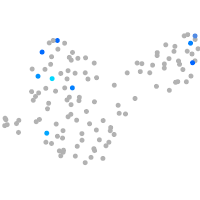
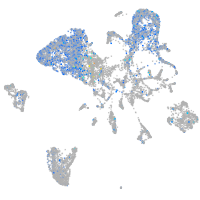
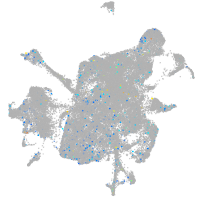
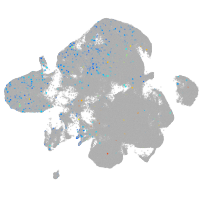
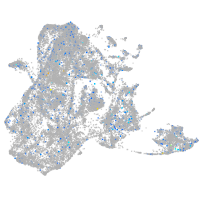
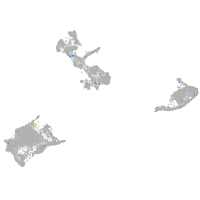
Gene expression UMAP
Display:
Expression
Stage
Other cell groups
all cells
blastomeres
PGCs
endoderm
axial mesoderm
muscle
mural cells /
non-skeletal muscle
mesenchyme
hematopoietic /
vasculature
pronephros
neural
spinal cord / glia
eye
taste / olfactory
otic / lateral line
epidermis
periderm
fin
ionocytes / mucous
pigment cells
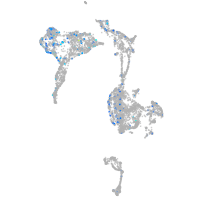
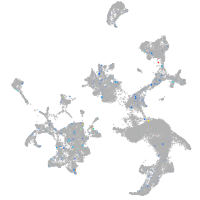
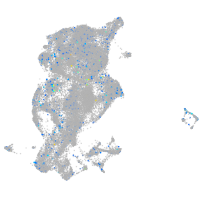
Expression by stage/cluster
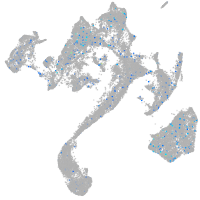
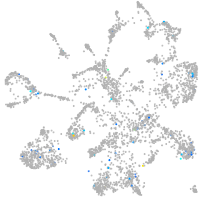
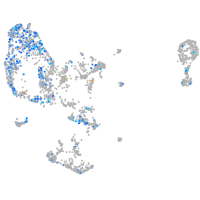
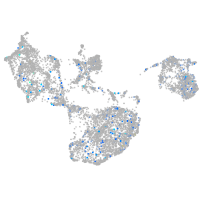
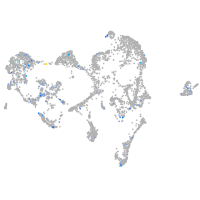
Correlated gene expression
Positive correlation
Negative correlation
Gene
r
Gene
r
meak7
0.073
adgrl3.1
-0.020
CR848665.1
0.064
rtn1a
-0.018
upp2
0.059
NC-002333.17
-0.017
CR354556.1
0.058
elavl3
-0.017
LO018260.1
0.057
nova2
-0.016
LOC103908978.1
0.055
tmem178b
-0.014
ftr60
0.053
nrxn1a
-0.013
AL935294.1
0.051
nhlh2
-0.013
LOC101884729
0.049
rps28
-0.013
BX927219.1
0.049
rpl37
-0.013
BX927234.1
0.049
myt1b
-0.013
ecm1a
0.046
dclk1b
-0.013
si:ch211-140l13.3
0.046
onecut2
-0.013
dicp1.19
0.046
si:dkey-151g10.6
-0.013
LOC100331067
0.045
rps29
-0.013
tespa1
0.045
stx1b
-0.013
BX323812.1
0.044
rpl39
-0.013
ptdss1b
0.043
phc2b
-0.013
LOC100331742
0.043
zgc:136461
-0.012
si:ch73-27e22.3
0.043
olfm2a
-0.012
BX908796.2
0.042
celf5a
-0.012
zgc:110353
0.042
zdhhc9
-0.012
XLOC-033065
0.041
sprn
-0.012
si:dkey-27d5.5
0.041
CABZ01029822.1
-0.012
nadsyn1
0.040
cnrip1a
-0.012
lrit2
0.040
cyp2ad2
-0.012
mir27a
0.040
pabpc1a
-0.012
CU928069.1
0.040
si:ch73-119p20.1
-0.011
LOC103909212.1
0.040
XLOC-022621
-0.011
her3
0.038
tuba1c
-0.011
LOC103911612
0.038
grem2b
-0.011
LOC108181189
0.038
rpl29
-0.011
CABZ01065684.1
0.038
rplp2l
-0.011
dapp1
0.037
gng3
-0.011
XLOC-026835
0.037
braf
-0.011