
glycoprotein M6Ab
ZFIN 
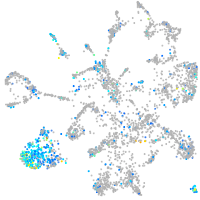
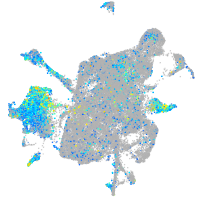
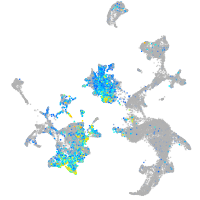
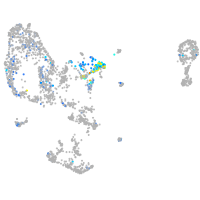
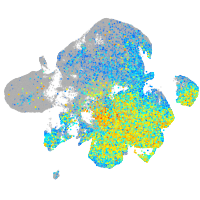
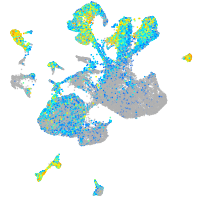
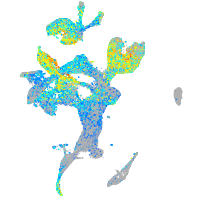
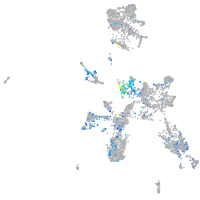
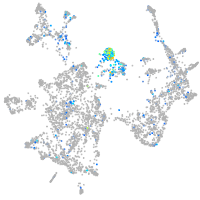
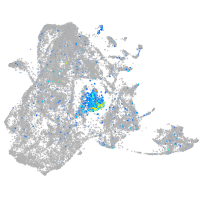
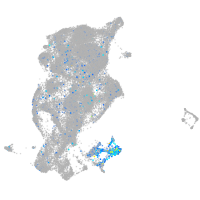
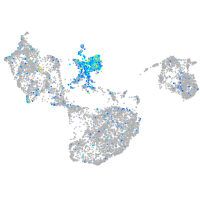
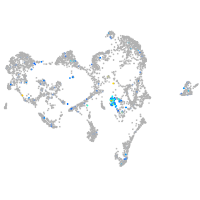
Gene expression UMAP


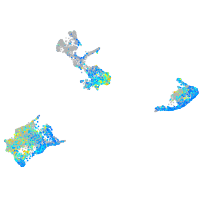
Expression by stage/cluster
Correlated gene expression
| Positive correlation | Negative correlation | ||
| Gene | r | Gene | r |
| gpm6aa | 0.505 | cyt1 | -0.127 |
| atp6v0cb | 0.466 | krt4 | -0.122 |
| rtn1a | 0.458 | wu:fb18f06 | -0.122 |
| stmn1b | 0.445 | si:ch211-195b11.3 | -0.109 |
| rtn1b | 0.411 | krt5 | -0.106 |
| tuba1c | 0.409 | zgc:193505 | -0.105 |
| gng3 | 0.406 | cfl1l | -0.099 |
| tmeff1b | 0.395 | ckap4 | -0.097 |
| tubb5 | 0.393 | zgc:175088 | -0.094 |
| elavl3 | 0.392 | anxa1a | -0.090 |
| ckbb | 0.390 | cyt1l | -0.090 |
| nova2 | 0.388 | si:ch211-157c3.4 | -0.089 |
| hmgb3a | 0.377 | selenow1 | -0.088 |
| sncb | 0.375 | cst14b.1 | -0.086 |
| cspg5a | 0.374 | agr1 | -0.084 |
| si:dkeyp-75h12.5 | 0.372 | mgst1.2 | -0.082 |
| fez1 | 0.367 | s100a10b | -0.081 |
| sypb | 0.366 | capns1a | -0.080 |
| mdkb | 0.366 | anxa1c | -0.080 |
| atpv0e2 | 0.362 | si:ch73-52f15.5 | -0.078 |
| cadm3 | 0.359 | mid1ip1a | -0.077 |
| marcksl1a | 0.349 | gsta.1 | -0.077 |
| nsg2 | 0.343 | anxa1b | -0.076 |
| stmn2a | 0.343 | icn2 | -0.076 |
| elavl4 | 0.343 | aldob | -0.073 |
| zc4h2 | 0.342 | pycard | -0.073 |
| snap25a | 0.338 | mgst2 | -0.072 |
| olfm1b | 0.338 | cd9b | -0.072 |
| tmsb2 | 0.338 | stx11b.1 | -0.071 |
| ywhag2 | 0.336 | stard14 | -0.070 |
| map1aa | 0.333 | zgc:162730 | -0.070 |
| tmem59l | 0.333 | lye | -0.068 |
| nrxn1a | 0.333 | anxa2a | -0.068 |
| vamp2 | 0.331 | si:ch211-105c13.3 | -0.067 |
| zgc:65894 | 0.328 | si:ch211-166a6.5 | -0.067 |