
glypican 4
ZFIN 
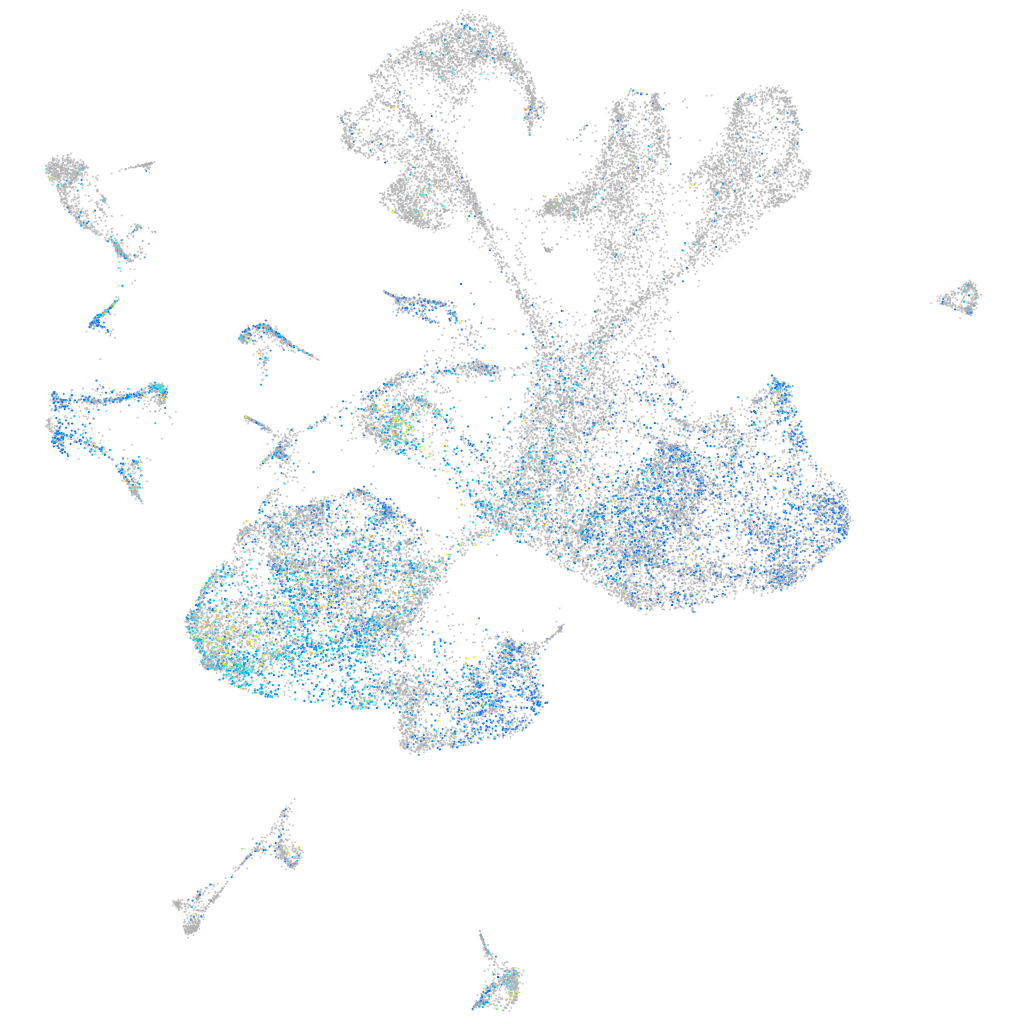
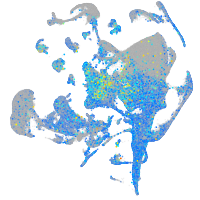
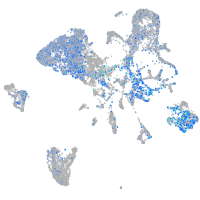
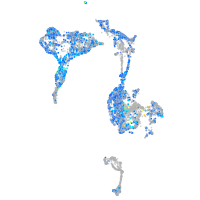
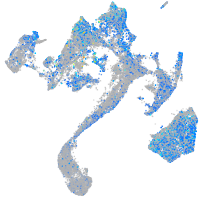
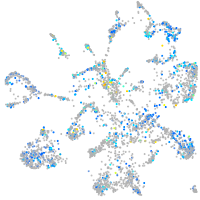
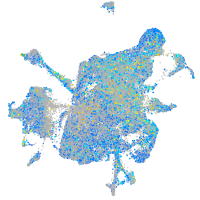
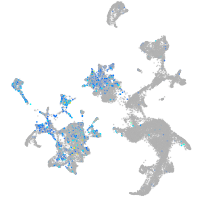
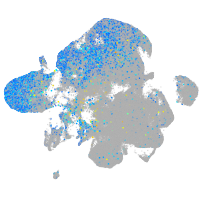
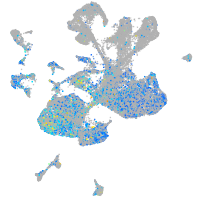
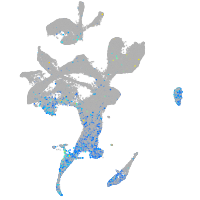
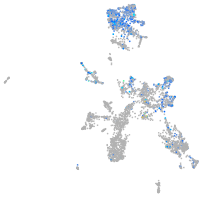
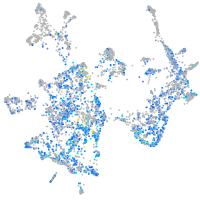
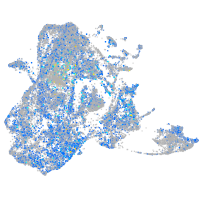
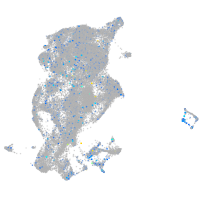
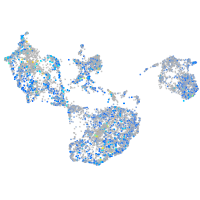
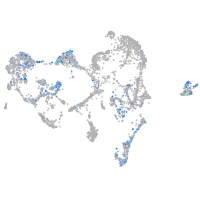
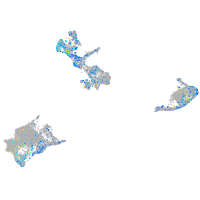
Gene expression UMAP


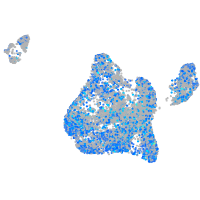
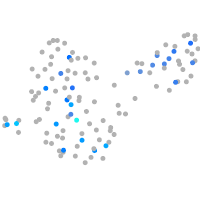

Expression by stage/cluster
Correlated gene expression
| Positive correlation | Negative correlation | ||
| Gene | r | Gene | r |
| slc1a3b | 0.202 | elavl3 | -0.206 |
| ptn | 0.192 | myt1b | -0.177 |
| id1 | 0.192 | ptmaa | -0.171 |
| ppap2d | 0.187 | stmn1b | -0.164 |
| atp1a1b | 0.186 | stxbp1a | -0.155 |
| gpm6bb | 0.183 | gng3 | -0.153 |
| fabp7a | 0.182 | stx1b | -0.150 |
| hmga2 | 0.181 | elavl4 | -0.147 |
| gpr37l1b | 0.180 | ptmab | -0.146 |
| atp1b4 | 0.180 | sncb | -0.146 |
| si:ch211-66e2.5 | 0.178 | snap25a | -0.145 |
| si:ch1073-303k11.2 | 0.178 | vamp2 | -0.144 |
| cspg5b | 0.177 | zc4h2 | -0.143 |
| ndnf | 0.176 | gng2 | -0.138 |
| fgfr2 | 0.176 | rtn1a | -0.136 |
| sox2 | 0.172 | h3f3d | -0.135 |
| zgc:165461 | 0.171 | cplx2 | -0.135 |
| slc1a2b | 0.170 | rtn1b | -0.133 |
| ptprfb | 0.167 | onecut1 | -0.132 |
| slc6a11b | 0.163 | atp6v0cb | -0.131 |
| hepacama | 0.160 | syt2a | -0.129 |
| cnn2 | 0.159 | tmem59l | -0.129 |
| notch3 | 0.159 | tmsb | -0.129 |
| s1pr1 | 0.153 | nsg2 | -0.128 |
| cd82a | 0.152 | tubb5 | -0.127 |
| ptprz1b | 0.151 | jagn1a | -0.127 |
| cd63 | 0.151 | scrt2 | -0.127 |
| mfge8a | 0.151 | LOC100537384 | -0.126 |
| metrnla | 0.148 | cplx2l | -0.126 |
| CU467822.1 | 0.147 | ywhag2 | -0.125 |
| ca4a | 0.146 | gpm6ab | -0.125 |
| wnt7aa | 0.144 | stmn2a | -0.125 |
| si:ch211-251b21.1 | 0.144 | myt1a | -0.125 |
| msi1 | 0.144 | si:dkey-276j7.1 | -0.123 |
| gnai2a | 0.143 | rbfox1 | -0.121 |