Daniocell
ggcta (taste / olfactory)
gamma-glutamylcyclotransferase a
ZFIN
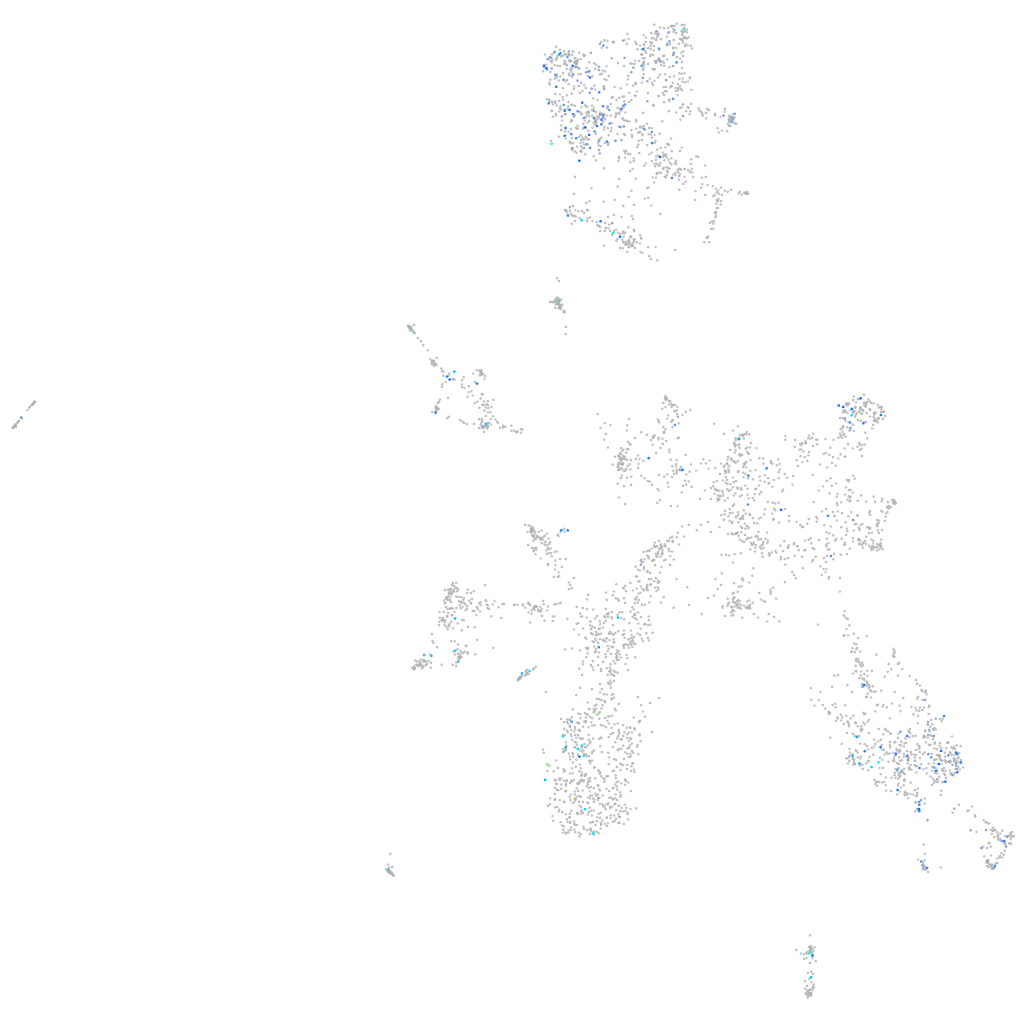
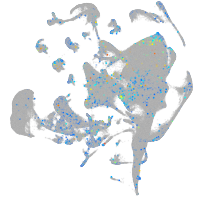
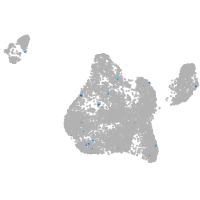
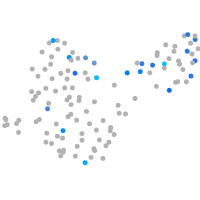
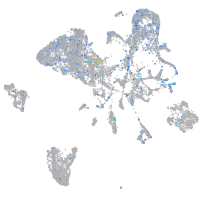
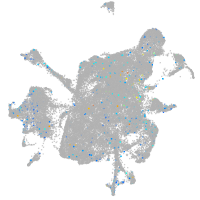
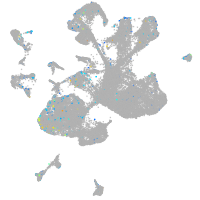
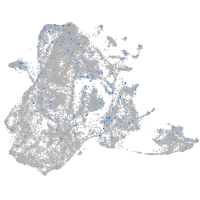
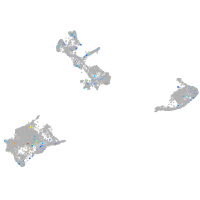
Gene expression UMAP
Display:
Expression
Stage
Other cell groups
all cells
blastomeres
PGCs
endoderm
axial mesoderm
muscle
mural cells /
non-skeletal muscle
mesenchyme
hematopoietic /
vasculature
pronephros
neural
spinal cord / glia
eye
taste / olfactory
otic / lateral line
epidermis
periderm
fin
ionocytes / mucous
pigment cells
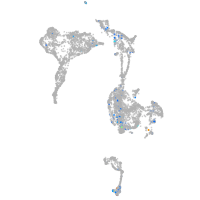
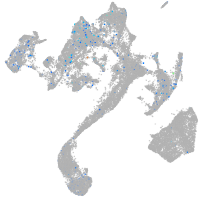
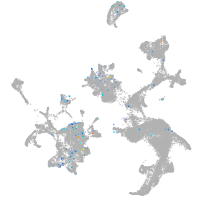
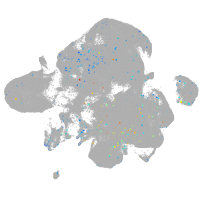
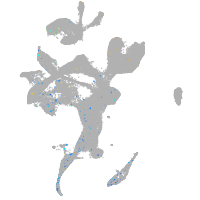
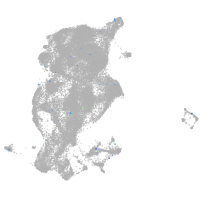
Expression by stage/cluster
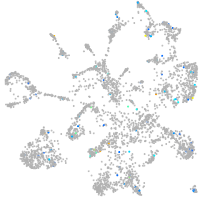
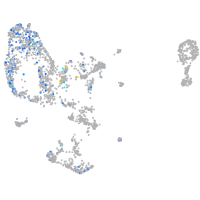
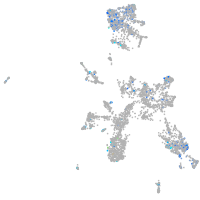
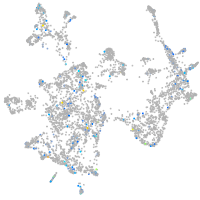
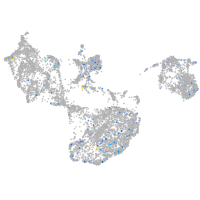
Correlated gene expression
Positive correlation
Negative correlation
Gene
r
Gene
r
XLOC-042923
0.204
snrpf
-0.086
si:dkey-239i20.4
0.178
si:dkey-56m19.5
-0.084
atp6v1c2
0.152
snrpg
-0.083
RF00322
0.150
snrpb
-0.080
XLOC-026004
0.144
marcksb
-0.079
NC-002333.19
0.136
hmgb2b
-0.077
si:ch211-249h16.8
0.136
hmgn2
-0.077
LOC110439428
0.132
srsf10b
-0.076
neto1l
0.132
tmeff1b
-0.075
si:ch211-64i20.3
0.129
si:ch211-222l21.1
-0.075
BX942821.1
0.128
apex1
-0.075
clic5b
0.128
CU467822.1
-0.075
entpd2b
0.127
rbbp4
-0.075
si:dkey-236e20.3
0.126
ptmab
-0.074
cd63
0.125
h2afvb
-0.073
opn7d
0.125
stmn1a
-0.073
si:ch1073-443f11.2
0.124
si:ch73-1a9.3
-0.073
si:ch211-152c2.3
0.124
hnrnpaba
-0.071
plac8.2
0.124
hspe1
-0.071
XLOC-036186
0.124
prmt1
-0.069
bmf1
0.124
nono
-0.069
si:ch211-160d20.5
0.123
snrpe
-0.069
zgc:165423
0.123
tmsb
-0.069
pink1
0.123
ewsr1a
-0.069
zgc:175139
0.123
tubb5
-0.068
tpd52
0.122
khsrp
-0.067
ano10a
0.121
ruvbl1
-0.066
ponzr6
0.121
hnrnpabb
-0.066
impa2
0.120
snrpd1
-0.065
tmem59
0.120
hmga1a
-0.064
LOC108191476
0.120
her15.1
-0.064
BX914220.1
0.119
cct3
-0.064
slc22a23
0.119
snu13b
-0.064
BX005129.2
0.118
rpa2
-0.061
CR388373.3
0.118
mcm7
-0.061