Daniocell
gba2 (epidermis)
"glucosidase, beta (bile acid) 2"
ZFIN
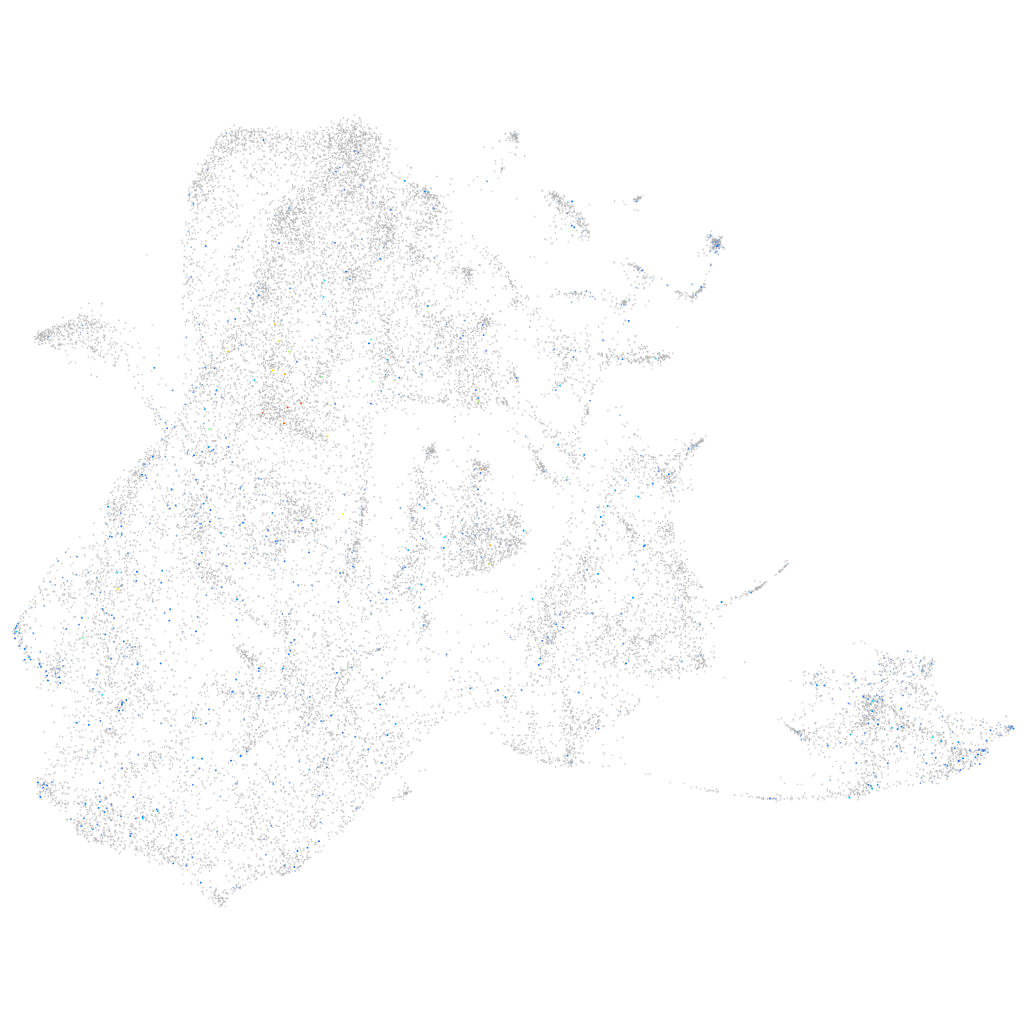
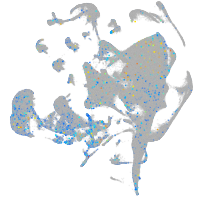
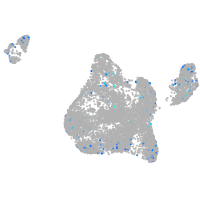
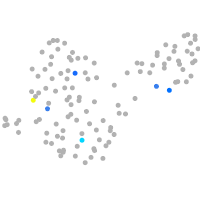
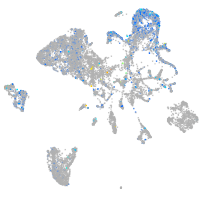
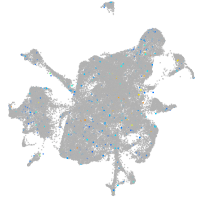
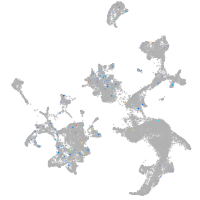
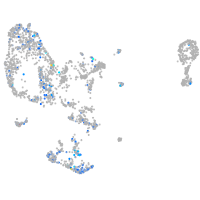
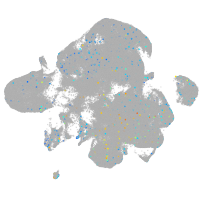
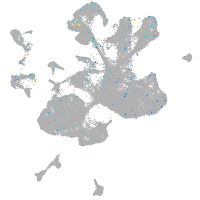
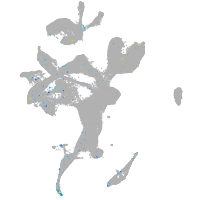
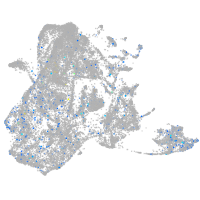
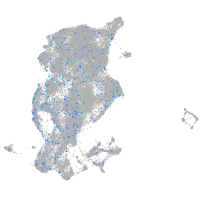
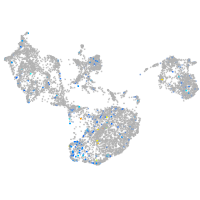
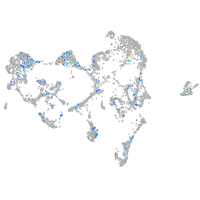
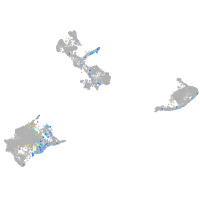
Gene expression UMAP
Display:
Expression
Stage
Other cell groups
all cells
blastomeres
PGCs
endoderm
axial mesoderm
muscle
mural cells /
non-skeletal muscle
mesenchyme
hematopoietic /
vasculature
pronephros
neural
spinal cord / glia
eye
taste / olfactory
otic / lateral line
epidermis
periderm
fin
ionocytes / mucous
pigment cells
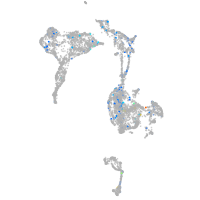
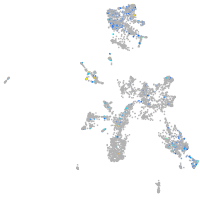
Expression by stage/cluster
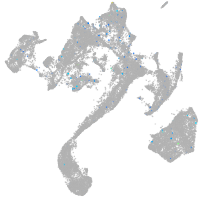
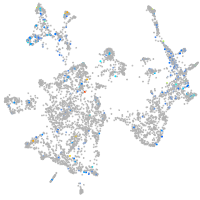
Correlated gene expression
Positive correlation
Negative correlation
Gene
r
Gene
r
tmem86b
0.106
zgc:136930
-0.050
si:ch73-264p11.1
0.104
si:dkey-183i3.5
-0.050
BX936305.1
0.082
zgc:77439
-0.049
si:dkey-45h7.1
0.081
cxl34b.11
-0.047
trnG
0.079
si:dkey-33c14.3
-0.044
si:ch211-117n7.7
0.077
krt91
-0.041
XLOC-005726
0.076
rbp4
-0.041
LOC101883916
0.076
aldh9a1a.1
-0.041
stpg1
0.074
si:ch211-76l23.4
-0.040
plppr4b
0.072
krt5
-0.038
si:dkey-286h2.3
0.072
eif4ebp3
-0.037
zgc:153499
0.071
ahcy
-0.036
CABZ01052810.1
0.070
mgarp
-0.035
glipr1a
0.068
CABZ01044281.1
-0.035
creb3l3l
0.068
epgn
-0.034
soul2
0.067
cckb
-0.034
epdl1
0.067
lgals1l1
-0.033
nqo1
0.065
rsl1d1
-0.033
pcdh2ab10
0.064
rpl13
-0.033
selenow2b
0.064
gamt
-0.032
LOC110437922
0.064
mmp30
-0.031
stard14
0.064
zgc:86896
-0.031
LOC101885373
0.063
col17a1a
-0.031
si:ch211-207n23.2
0.063
sparc
-0.030
plekhf1
0.063
krtt1c19e
-0.030
si:dkey-184p9.7
0.062
ddx21
-0.029
si:ch73-52f15.5
0.062
gapdhs
-0.029
si:ch211-195b11.3
0.062
mylipb
-0.029
pla1a
0.062
rpl32
-0.028
rnf183
0.061
rps2
-0.028
zgc:110333
0.061
nop53
-0.028
pls1
0.061
rpl5a
-0.028
myo15ab
0.060
ptgdsb.1
-0.028
LOC108192079
0.060
fam169aa
-0.028
ANXA1 (1 of many)
0.060
dap1b
-0.027