Daniocell
fyco1b (mesenchyme)
FYVE and coiled-coil domain autophagy adaptor 1b
ZFIN
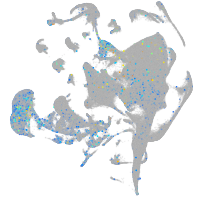
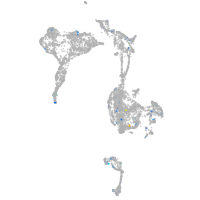
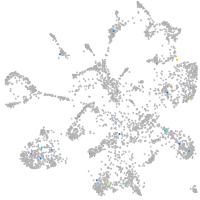
Gene expression UMAP
Display:
Expression
Stage
Other cell groups
all cells
blastomeres
PGCs
endoderm
axial mesoderm
muscle
mural cells /
non-skeletal muscle
mesenchyme
hematopoietic /
vasculature
pronephros
neural
spinal cord / glia
eye
taste / olfactory
otic / lateral line
epidermis
periderm
fin
ionocytes / mucous
pigment cells
Expression by stage/cluster
Correlated gene expression
Positive correlation
Negative correlation
Gene
r
Gene
r
si:dkey-27n6.1.1
0.123
rplp0
-0.030
mxd
0.099
rps2
-0.027
LOC110440044
0.095
rps7
-0.026
mir2193.1
0.094
rpl28
-0.025
BX323559.3
0.082
rps27.1
-0.024
scn4aa
0.073
rplp1
-0.024
CR954285.1
0.067
rps27a
-0.023
XLOC-012561
0.064
rpl7
-0.022
LOC100330744
0.062
rpl39
-0.022
ctxn1
0.060
rps21
-0.022
si:ch211-284e13.11
0.059
rpl7a
-0.022
LOC108191636
0.059
rpl23
-0.021
LOC101882178
0.057
rps20
-0.021
gdpd4a
0.057
rpl27a
-0.021
tnfsf10l3
0.057
rpl14
-0.021
BX321882.1
0.055
rpl12
-0.020
or126-4
0.055
ran
-0.020
LOC101885637
0.054
rpl19
-0.020
calhm1
0.053
rpl35
-0.019
si:ch73-106n3.1
0.053
rps24
-0.019
CU695215.2
0.051
rps23
-0.019
CU571091.1
0.050
snrpe
-0.018
si:ch73-368j24.3
0.050
ptges3b
-0.018
RAMP3
0.050
rps5
-0.017
FQ377896.1
0.050
rps12
-0.017
pimr128
0.049
eef1a1l1
-0.017
LOC108181183
0.049
rpl10
-0.017
si:ch211-11p18.6
0.048
rpl26
-0.017
si:ch211-165a10.5.1
0.047
rpl10a
-0.017
gpr176
0.047
eif3d
-0.017
XLOC-032843
0.047
eef1g
-0.017
agtrap
0.046
rps25
-0.017
LOC101885868
0.045
COX7A2 (1 of many)
-0.017
LOC572443
0.045
rps19
-0.016
si:ch1073-365p7.2
0.045
si:dkey-151g10.6
-0.016