Daniocell
fyco1a (periderm)
FYVE and coiled-coil domain autophagy adaptor 1a
ZFIN
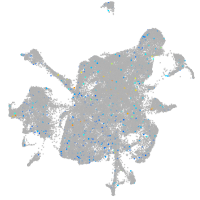
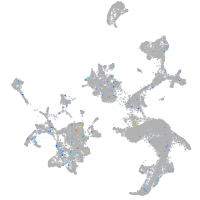
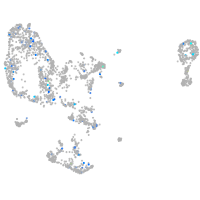
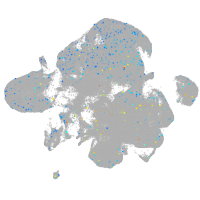
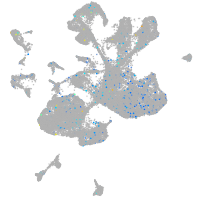
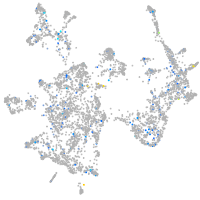
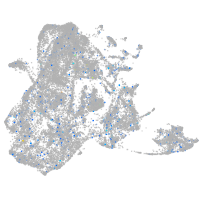
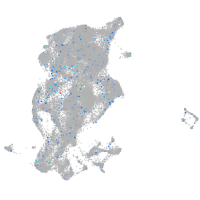
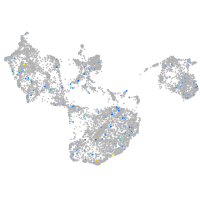
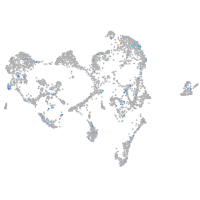
Gene expression UMAP
Display:
Expression
Stage
Other cell groups
all cells
blastomeres
PGCs
endoderm
axial mesoderm
muscle
mural cells /
non-skeletal muscle
mesenchyme
hematopoietic /
vasculature
pronephros
neural
spinal cord / glia
eye
taste / olfactory
otic / lateral line
epidermis
periderm
fin
ionocytes / mucous
pigment cells
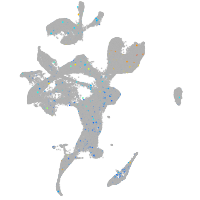
Expression by stage/cluster
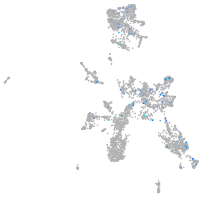
Correlated gene expression
Positive correlation
Negative correlation
Gene
r
Gene
r
si:dkey-201i6.8
0.138
krt17
-0.033
LOC110437787
0.134
rps15a
-0.032
CR925804.1
0.095
krt4
-0.032
tacr1b
0.092
rps24
-0.032
gfra4b
0.086
btf3
-0.032
LOC110438203
0.086
rpl39
-0.030
cytip
0.080
faua
-0.030
LOC100536890
0.079
rps20
-0.029
BX248390.1
0.079
si:dkey-151g10.6
-0.029
foxo6a
0.075
cyt1
-0.028
LOC103910418
0.070
rps27.1
-0.027
pleca
0.069
rpl19
-0.027
si:dkey-20i20.10
0.069
rpl38
-0.027
wdr17
0.068
naca
-0.026
LOC100005584
0.065
rps2
-0.026
gpr55a
0.063
anxa2a
-0.026
NC-002333.4
0.063
si:ch211-195b11.3
-0.026
CR383676.1
0.062
actb2
-0.026
zgc:171424
0.061
rpl23
-0.026
LOC108179558
0.060
rpl36a
-0.026
bbs9
0.058
rplp2l
-0.026
tradv24.0.1
0.058
rps23
-0.025
tekt2
0.058
rps4x
-0.025
mast2
0.058
cyt1l
-0.025
acin1a
0.058
rpl37
-0.025
LOC108182124
0.058
rps11
-0.025
LOC110438943
0.057
rpl17
-0.024
wnk1a
0.056
rplp1
-0.024
snx21
0.056
s100a10b
-0.023
LOC103908748
0.056
gsta.1
-0.023
NC-002333.17
0.056
rpl10a
-0.023
si:ch211-53m15.2
0.056
rpl12
-0.023
BX927122.2
0.055
rps26l
-0.022
cdh12a
0.055
rpl7a
-0.022
CABZ01066611.1
0.055
krt91
-0.022