Daniocell
fpgt (eye)
fucose-1-phosphate guanylyltransferase
ZFIN
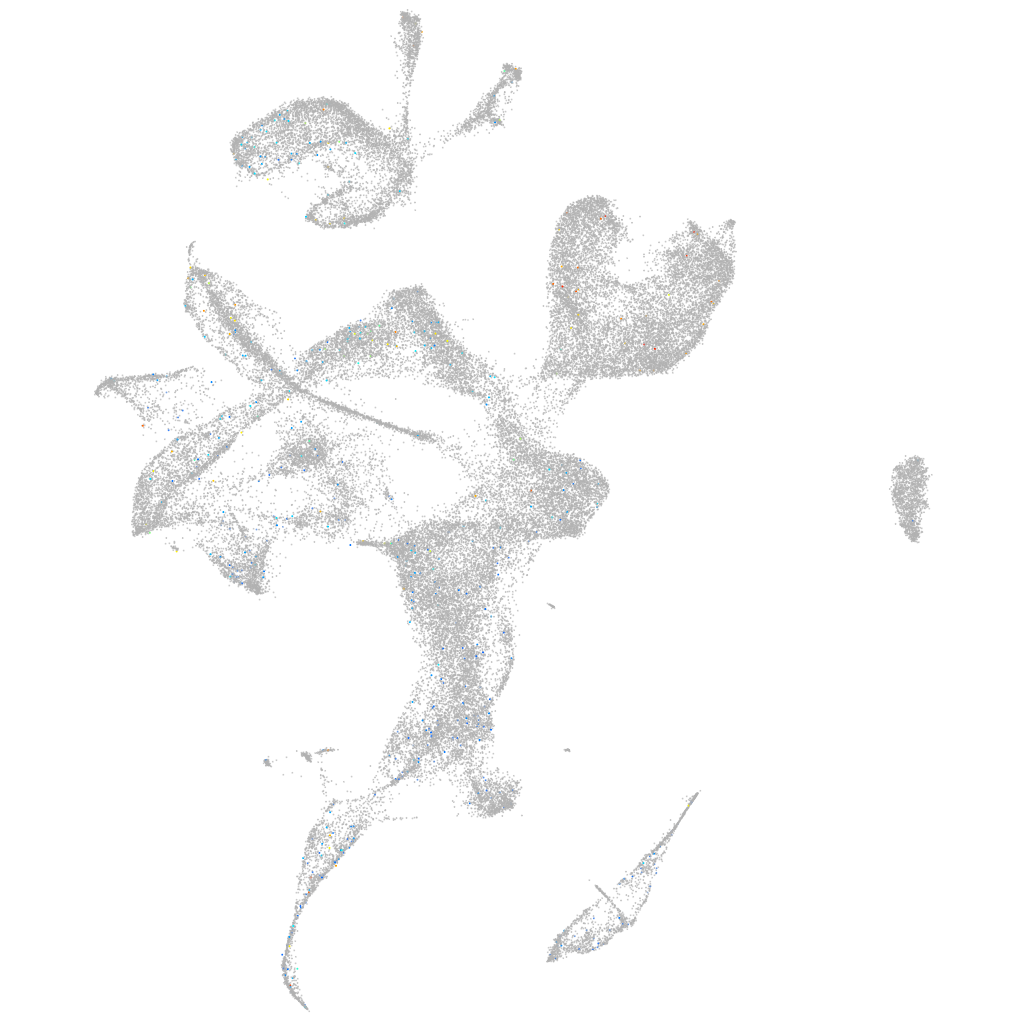
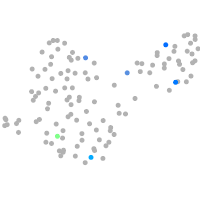
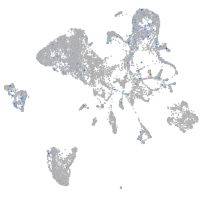
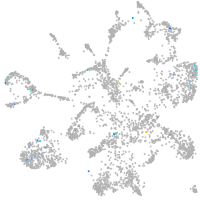
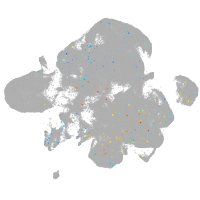
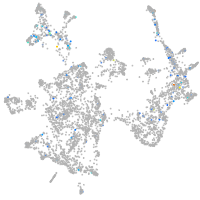
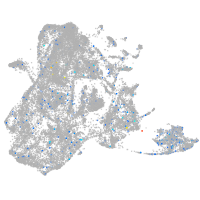
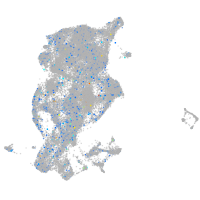
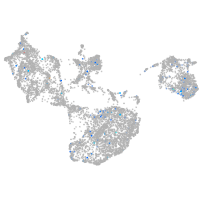
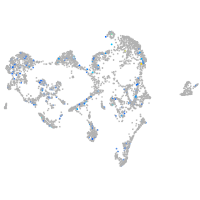
Gene expression UMAP
Display:
Expression
Stage
Other cell groups
all cells
blastomeres
PGCs
endoderm
axial mesoderm
muscle
mural cells /
non-skeletal muscle
mesenchyme
hematopoietic /
vasculature
pronephros
neural
spinal cord / glia
eye
taste / olfactory
otic / lateral line
epidermis
periderm
fin
ionocytes / mucous
pigment cells
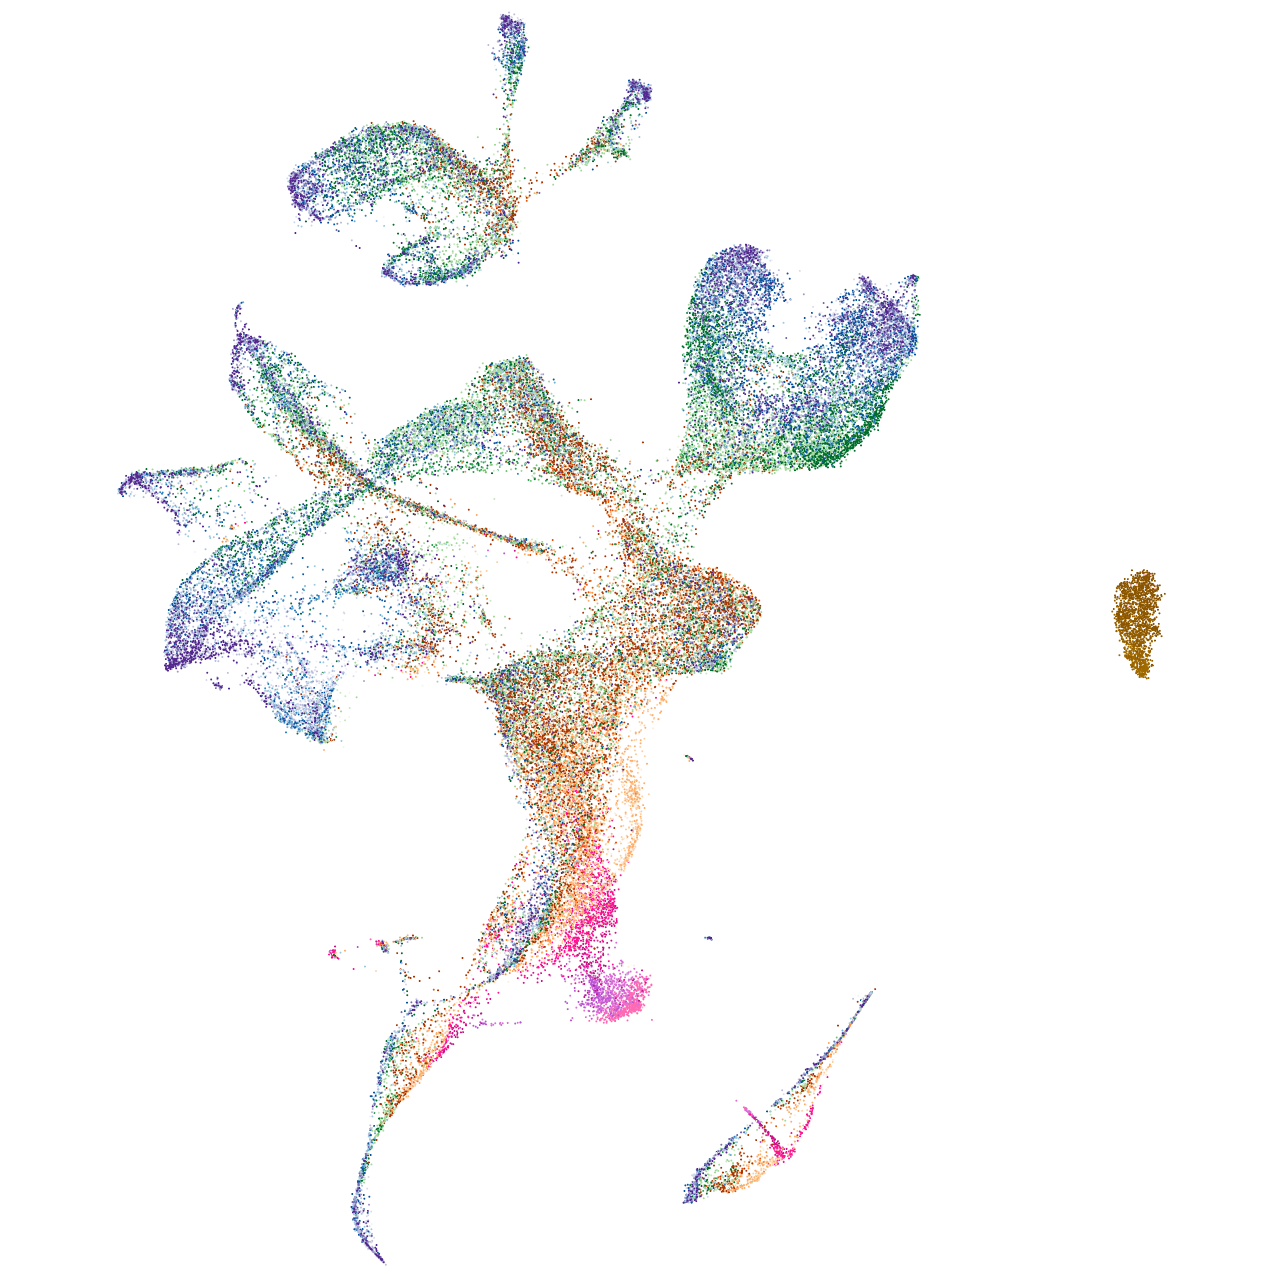
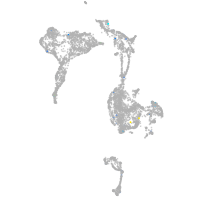
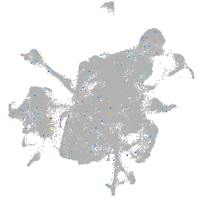
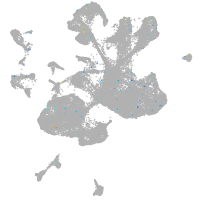
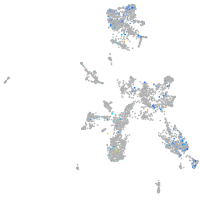
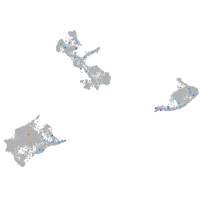
Expression by stage/cluster
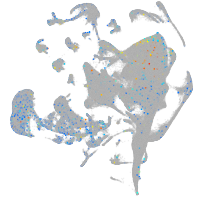
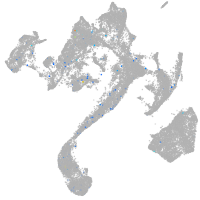
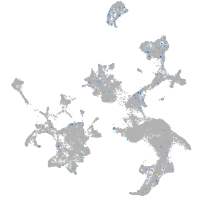
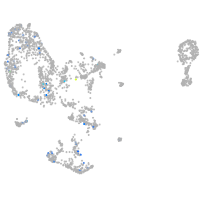
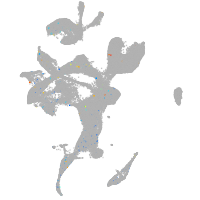
Correlated gene expression
Positive correlation
Negative correlation
Gene
r
Gene
r
itln1
0.120
si:ch211-222l21.1
-0.027
si:dkey-53k12.2
0.095
hmgb2b
-0.026
si:dkey-201i24.3
0.063
ptmab
-0.025
LOC101884899
0.060
hmga1a
-0.022
si:dkey-88n24.11
0.058
tp53inp2
-0.021
CABZ01088982.1
0.057
h2afvb
-0.019
LOC110438801
0.051
si:ch73-1a9.3
-0.019
XLOC-039747
0.051
fabp3
-0.018
LOC100006401
0.048
rsf1b.1
-0.018
CABZ01055707.1
0.048
hmgn2
-0.018
BX255963.1
0.047
mcm7
-0.018
odf3b
0.047
snrpd1
-0.017
BX248238.2
0.046
hmgb1b
-0.017
si:ch211-250n8.1
0.045
seta
-0.017
BX530018.1
0.045
mcm2
-0.017
si:dkey-243k1.3
0.044
cdca7a
-0.017
LOC103909784
0.043
mcm6
-0.017
XLOC-023730
0.043
hnrnpub
-0.017
LOC110439379
0.041
mcm4
-0.017
si:ch211-229n2.7
0.039
rcc2
-0.016
LOC101884019
0.038
ddx39aa
-0.016
zgc:136683
0.038
hmgb2a
-0.016
LOC101884484
0.038
cdc6
-0.016
si:dkey-42l23.4
0.038
si:ch211-137a8.4
-0.016
XLOC-013311
0.038
mcm5
-0.016
clcn2a
0.037
lig1
-0.016
LOC103911664
0.037
hmgb1a
-0.016
tek
0.037
cdca7b
-0.016
micall1b.2
0.036
sox11b
-0.015
slc24a5
0.036
hnrnph1l
-0.015
bace2
0.036
si:dkey-56m19.5
-0.015
zgc:194908
0.035
hsp90ab1
-0.015
dct
0.035
pcna
-0.015
si:ch211-218h8.3
0.035
mycla
-0.015
LOC110437915
0.035
phc2a
-0.015