Daniocell
foxo3a (taste / olfactory)
forkhead box O3A
ZFIN
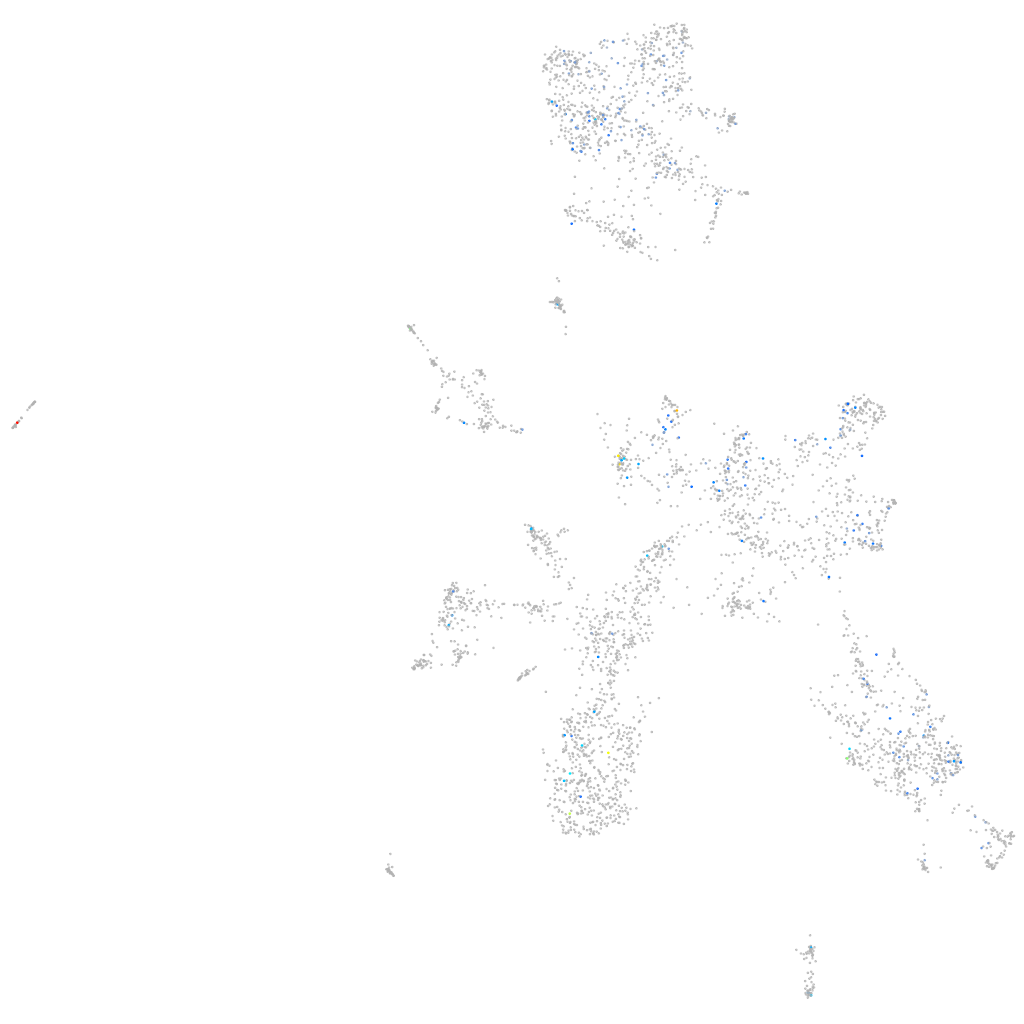
Gene expression UMAP
Display:
Expression
Stage
Other cell groups
all cells
blastomeres
PGCs
endoderm
axial mesoderm
muscle
mural cells /
non-skeletal muscle
mesenchyme
hematopoietic /
vasculature
pronephros
neural
spinal cord / glia
eye
taste / olfactory
otic / lateral line
epidermis
periderm
fin
ionocytes / mucous
pigment cells
Expression by stage/cluster
Correlated gene expression
Positive correlation
Negative correlation
Gene
r
Gene
r
LOC798089
0.349
cox8a
-0.054
LOC110437727
0.235
rpl28
-0.052
si:dkey-27d5.3
0.189
rps12
-0.052
LOC110440093
0.182
rpl31
-0.048
AL590150.1
0.182
naca
-0.048
ccl38.1
0.177
actc1b
-0.047
tmem82
0.175
ndufa1
-0.046
wnt6b
0.173
h3f3c
-0.045
XLOC-016045
0.173
rpl29
-0.045
mylka
0.170
capsla
-0.043
sat1a.1
0.170
capslb
-0.042
atrnl1a
0.170
rpl35a
-0.041
si:dkeyp-4f2.6
0.169
rpl34
-0.041
CT025771.1
0.168
rack1
-0.041
tlr8b
0.166
nme3
-0.041
si:dkeyp-35e5.5
0.164
pfdn4
-0.041
lingo3a
0.163
atp5md
-0.040
XLOC-012572
0.162
rpl38
-0.039
si:ch211-63p21.1
0.160
tpt1
-0.038
LOC101885528.1
0.159
h3f3d
-0.038
XLOC-006367
0.158
mylpfa
-0.037
snx19a
0.158
tshz3b
-0.036
trhrb
0.155
hsp90ab1
-0.036
LOC561873
0.155
LOC101884799
-0.035
si:ch73-361p23.3
0.154
si:dkey-43k4.3
-0.034
plppr2a
0.149
si:ch211-67f24.7
-0.034
ptprh
0.149
pomp
-0.034
LOC110440075
0.148
tma7
-0.034
si:ch211-161c3.5
0.148
meig1
-0.033
parvg
0.146
cox7c
-0.033
XLOC-026713
0.146
mycbp
-0.033
adprh
0.145
zgc:92818
-0.033
csf2rb
0.144
tmem39b
-0.033
LOC100151603
0.143
atp5pb
-0.033
si:ch211-214k5.6
0.142
camlg
-0.032