Daniocell
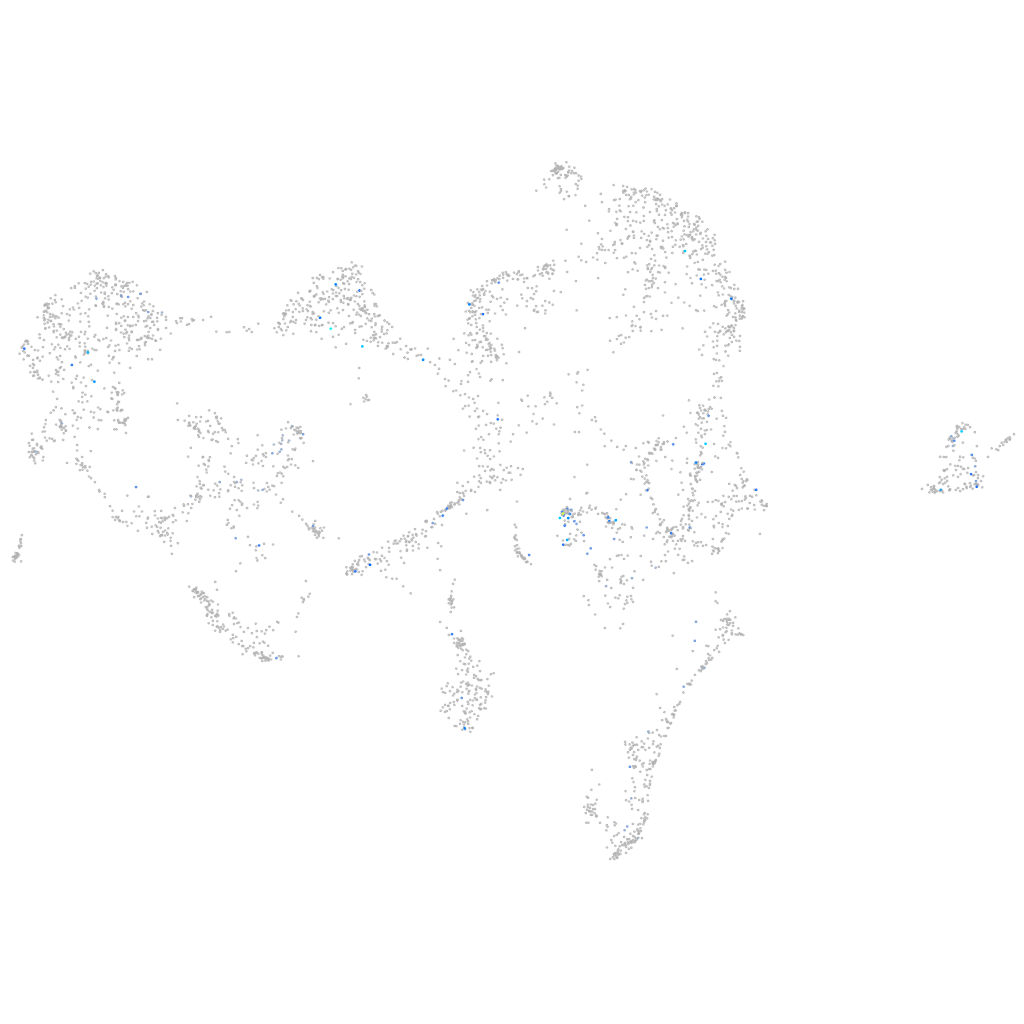
foxo3a (ionocytes / mucous-producing)
forkhead box O3A
ZFIN
Gene expression UMAP
Display:
Expression
Stage
Other cell groups
all cells
blastomeres
PGCs
endoderm
axial mesoderm
muscle
mural cells /
non-skeletal muscle
mesenchyme
hematopoietic /
vasculature
pronephros
neural
spinal cord / glia
eye
taste / olfactory
otic / lateral line
epidermis
periderm
fin
ionocytes / mucous
pigment cells
Expression by stage/cluster
Correlated gene expression
Positive correlation
Negative correlation
Gene
r
Gene
r
cacng7b
0.299
s100v2
-0.057
npy7r
0.292
wu:fb18f06
-0.054
slc17a8
0.292
aldob
-0.052
ptchd1
0.286
krt4
-0.050
kcnj3b
0.285
b4galnt3b
-0.049
st6gal1
0.284
s100w
-0.044
pyya
0.281
cyt1l
-0.042
unm-sa808
0.279
fuca1.1
-0.041
pcdh1g31
0.277
elovl1a
-0.041
lft2
0.270
zgc:193505
-0.040
LOC568754
0.268
si:ch211-218c6.8
-0.040
LOC101882231
0.268
gcnt4a
-0.040
si:ch73-335m24.5
0.268
si:ch211-195b11.3
-0.039
adgrb3
0.266
bicdl2l
-0.038
kcnh7
0.261
XLOC-027129
-0.038
lrrtm1
0.256
zgc:92481
-0.038
si:ch211-269c21.2
0.254
uap1
-0.037
dao.2
0.252
rnf183
-0.037
CR847936.10
0.243
icn
-0.037
si:ch211-222n4.2
0.242
nccrp1
-0.037
tmeff2b
0.241
capn8
-0.037
atp6ap1a
0.241
cst14b.1
-0.037
atp6v0cb
0.240
si:ch211-105c13.3
-0.036
cacng4b
0.233
irs2b
-0.036
sypb
0.233
malb
-0.036
trpc1
0.233
usp2b
-0.036
nrcama
0.231
f2rl1.2
-0.035
lrrtm2
0.224
si:dkey-33i11.9
-0.035
si:ch211-155o21.3
0.222
cldnh
-0.035
si:dkey-174m14.3
0.219
wbp2nl
-0.035
si:dkey-266f7.4
0.218
si:ch211-232i5.1
-0.035
abcc8
0.215
XLOC-041945
-0.035
srpk2
0.212
cyt1
-0.035
ptpn5
0.211
si:dkey-193p11.2
-0.035
scg2b
0.210
rhcgl1
-0.034