Daniocell
flt4 (pigment cells)
fms-related tyrosine kinase 4
ZFIN
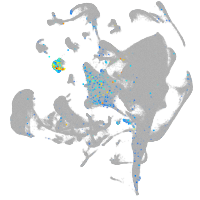
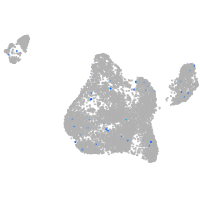
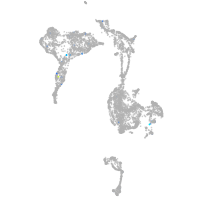
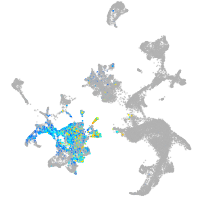
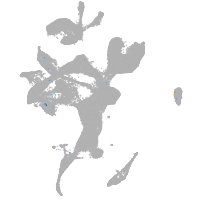
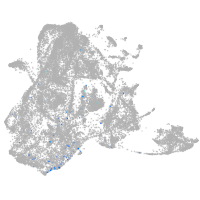
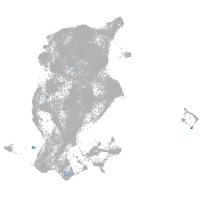
Gene expression UMAP
Display:
Expression
Stage
Other cell groups
all cells
blastomeres
PGCs
endoderm
axial mesoderm
muscle
mural cells /
non-skeletal muscle
mesenchyme
hematopoietic /
vasculature
pronephros
neural
spinal cord / glia
eye
taste / olfactory
otic / lateral line
epidermis
periderm
fin
ionocytes / mucous
pigment cells
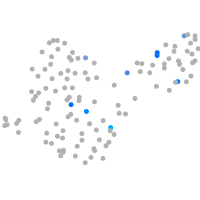
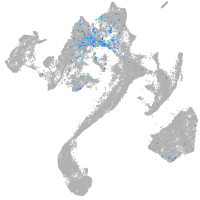
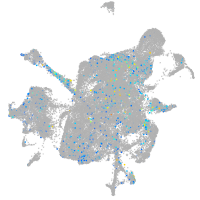
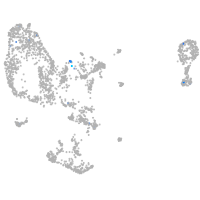
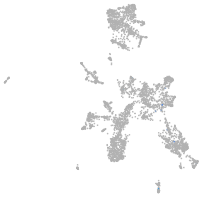
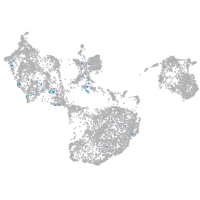
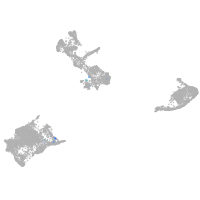
Expression by stage/cluster
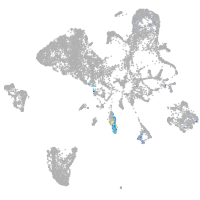
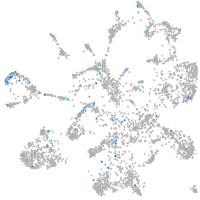
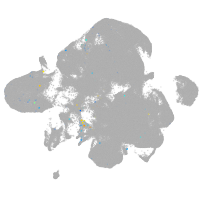
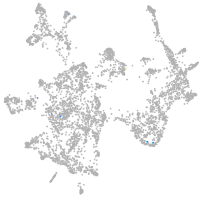
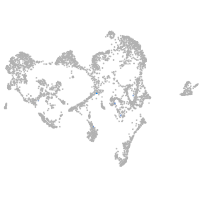
Correlated gene expression
Positive correlation
Negative correlation
Gene
r
Gene
r
mrc1b
0.577
gstp1
-0.047
adgrl4
0.462
rps14
-0.028
LOC103908925
0.460
csrp2
-0.026
si:dkey-23n7.10
0.415
rpl9
-0.024
XLOC-006500
0.412
zgc:110339
-0.023
tnfaip2b
0.411
myhz1.1
-0.023
notchl
0.402
si:ch211-251b21.1
-0.023
lcp2a
0.379
eef1g
-0.022
si:ch211-12e13.12
0.347
mlpha
-0.022
fgd5a
0.297
cox4i2
-0.021
CABZ01078350.1
0.296
slc45a2
-0.021
tie1
0.292
tpma
-0.021
si:ch211-33e4.2
0.286
phyhd1
-0.020
kdr
0.272
mdh1aa
-0.019
LOC101882264
0.270
krt18b
-0.019
snx21
0.259
aldh9a1a.1
-0.019
LO018315.7
0.253
LOC101886030
-0.019
mrc1a
0.250
smim29
-0.018
myct1a
0.239
oacyl
-0.018
erg
0.233
rps3a
-0.018
si:ch211-66e2.3
0.230
si:dkey-204f11.64
-0.018
LOC108180727
0.226
eif4a1b
-0.018
loxl1
0.225
rab27a
-0.018
LOC100006216
0.224
aqp3a
-0.018
eevs
0.220
eif4ebp3
-0.018
ldlra
0.218
acta1b
-0.018
XLOC-012572
0.217
gsto2
-0.017
si:ch211-136m16.8
0.211
pfn2
-0.017
si:rp71-39b20.4
0.205
bscl2l
-0.017
ca15a
0.204
pcbd1
-0.017
sned1
0.201
si:dkey-7j14.6
-0.017
zgc:162872
0.199
uraha
-0.017
cnfn
0.198
dctn3
-0.017
tspan11
0.197
cbr1l
-0.017
arhgap27l
0.195
tnni2a.4
-0.017