Daniocell
fhl3a (periderm)
four and a half LIM domains 3a
ZFIN
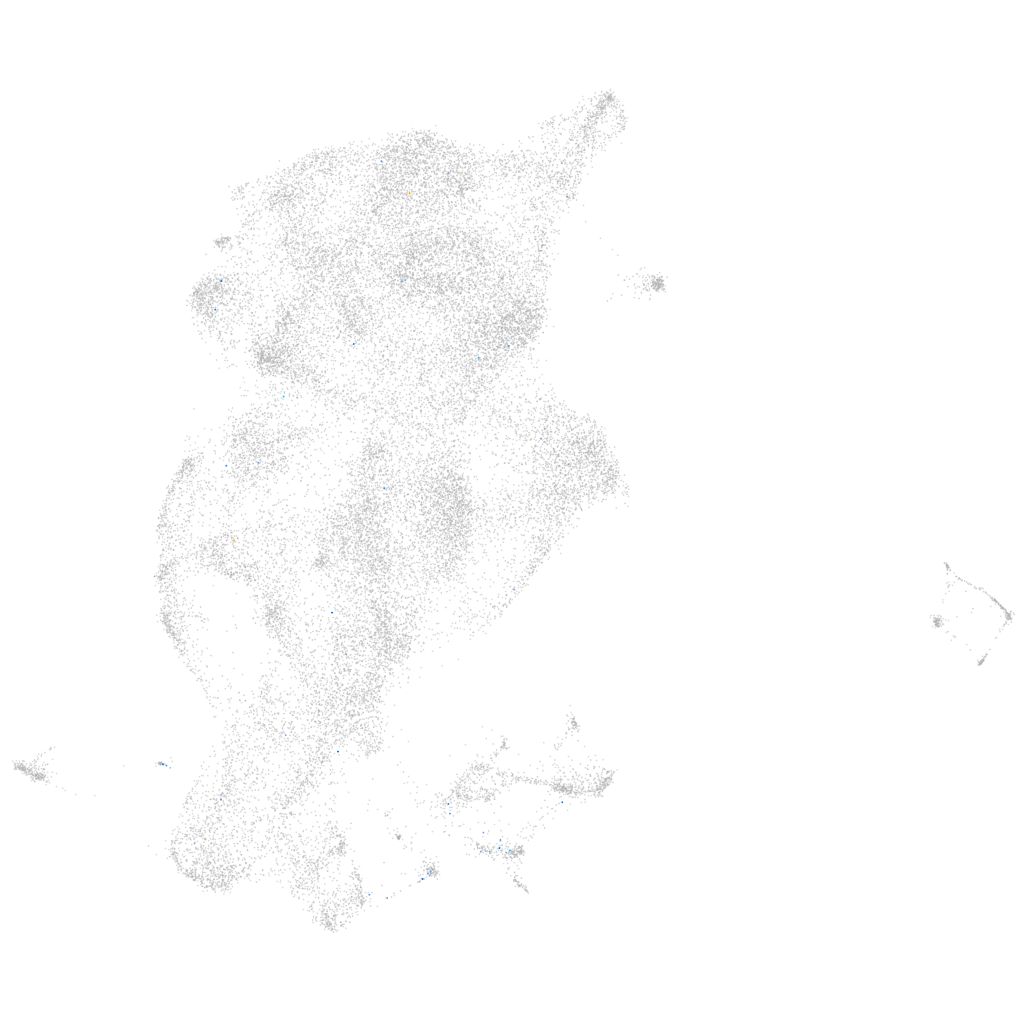
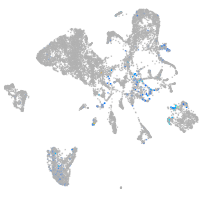
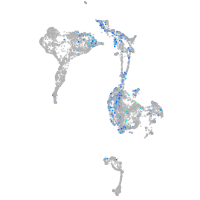
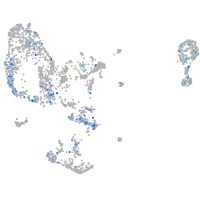
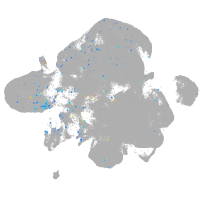
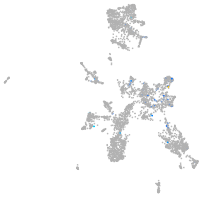
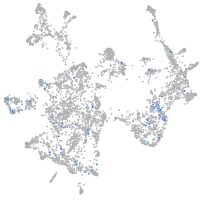
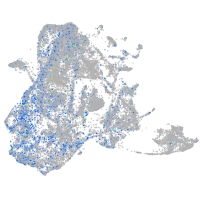
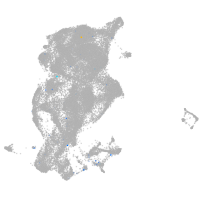
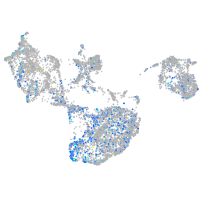
Gene expression UMAP
Display:
Expression
Stage
Other cell groups
all cells
blastomeres
PGCs
endoderm
axial mesoderm
muscle
mural cells /
non-skeletal muscle
mesenchyme
hematopoietic /
vasculature
pronephros
neural
spinal cord / glia
eye
taste / olfactory
otic / lateral line
epidermis
periderm
fin
ionocytes / mucous
pigment cells
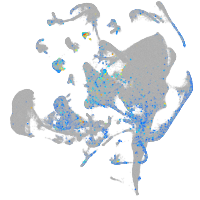
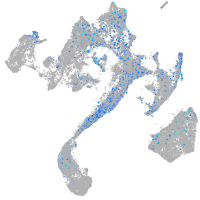
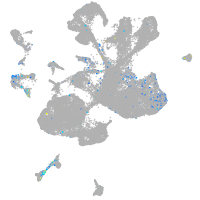
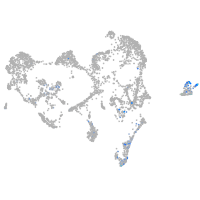
Expression by stage/cluster
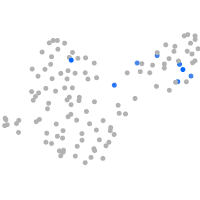
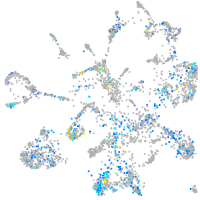
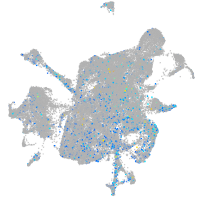
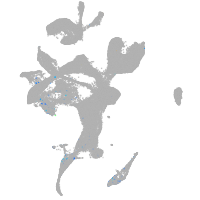
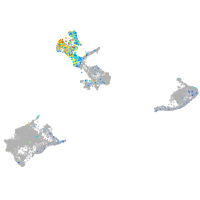
Correlated gene expression
Positive correlation
Negative correlation
Gene
r
Gene
r
trpc4b
0.280
scel
-0.022
akap12a
0.245
eef1da
-0.022
CR848749.2
0.243
si:dkey-151g10.6
-0.020
chrm4a
0.201
aldob
-0.020
gpnmb
0.169
rpl34
-0.019
XLOC-007364
0.163
krtt1c19e
-0.019
tpd52l1
0.161
rps4x
-0.018
msh5
0.153
rpl10
-0.018
slco1c1
0.144
rps9
-0.017
lypc
0.138
cyt1
-0.017
XLOC-031547
0.138
tpt1
-0.016
dyrk4
0.130
rps24
-0.015
dact1
0.127
hspa8
-0.014
pnp4a
0.116
mhc1zba
-0.014
LOC110440119
0.113
hunk
-0.014
LOC108183847
0.110
cldnb
-0.014
BX530017.1
0.109
XLOC-011066
-0.014
XLOC-036510
0.100
eif4ebp3
-0.013
CABZ01111555.1
0.100
krt5
-0.013
FP102018.1
0.098
cox17
-0.013
FITM1 (1 of many)
0.096
wu:fb18f06
-0.013
si:dkey-11o1.7
0.096
selenow2b
-0.013
tagln3b
0.092
si:ch211-217k17.7
-0.013
rasl12
0.092
rps27.1
-0.013
CR626884.1
0.092
ddx21
-0.013
P2RY14
0.092
echdc2
-0.013
si:ch211-87j1.4
0.091
si:ch211-105c13.3
-0.013
pth2
0.090
bckdhb
-0.012
kcng2
0.090
hrc
-0.012
dab2ipa
0.088
soul2
-0.012
CU929346.1
0.087
LOC100535170
-0.012
htra1a
0.086
naca
-0.012
tnnt2a
0.086
rplp2
-0.012
s1pr3a
0.086
chac1
-0.012
LOC101884529
0.085
rpl15
-0.012