Daniocell
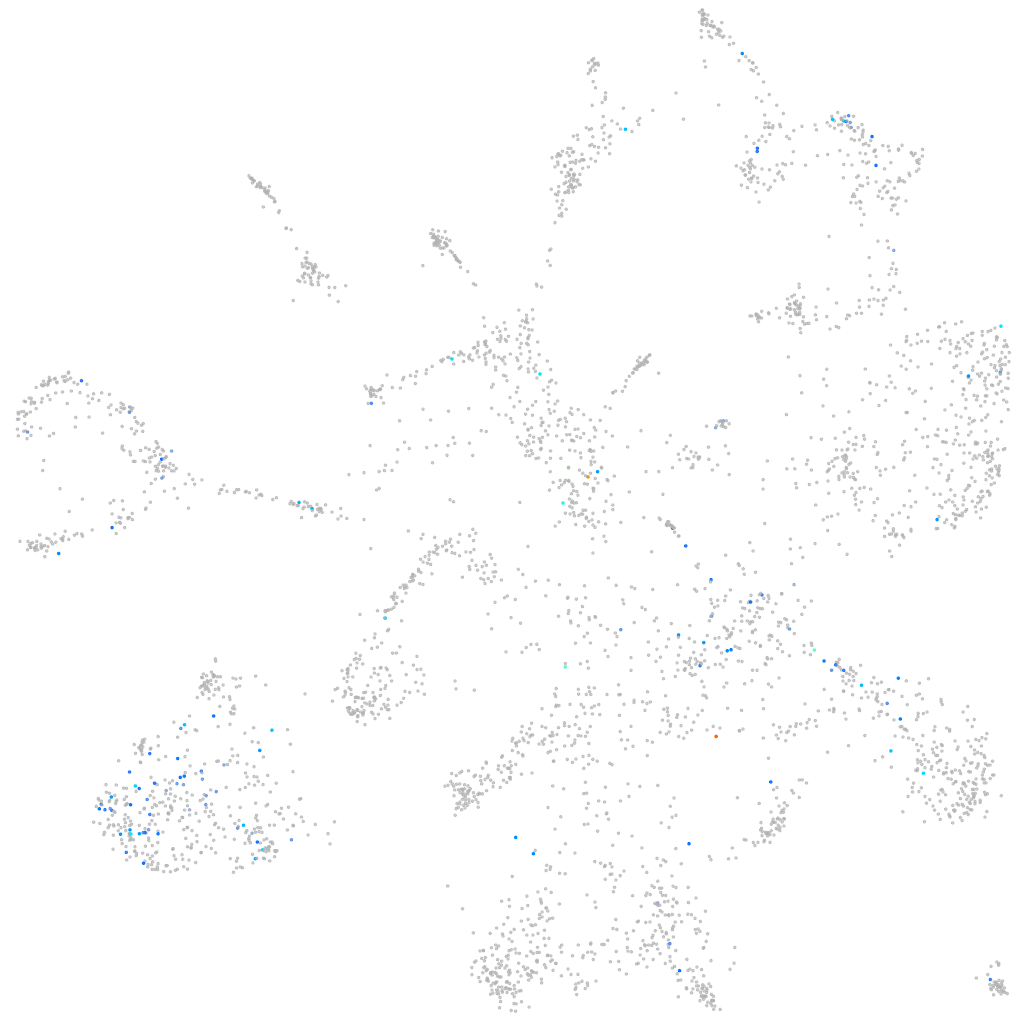
fgf12b (mural cells / non-skeletal muscle)
fibroblast growth factor 12b
ZFIN
Gene expression UMAP
Display:
Expression
Stage
Other cell groups
all cells
blastomeres
PGCs
endoderm
axial mesoderm
muscle
mural cells /
non-skeletal muscle
mesenchyme
hematopoietic /
vasculature
pronephros
neural
spinal cord / glia
eye
taste / olfactory
otic / lateral line
epidermis
periderm
fin
ionocytes / mucous
pigment cells
Expression by stage/cluster
Correlated gene expression
Positive correlation
Negative correlation
Gene
r
Gene
r
si:ch211-229l10.11
0.289
myl9a
-0.059
ttll3
0.262
eef1a1l1
-0.058
si:dkey-102c8.2
0.246
pmp22a
-0.057
CABZ01046954.1
0.216
tmsb4x
-0.056
crocc2
0.196
zgc:162730
-0.052
hpn
0.186
gsna
-0.050
XLOC-027111
0.186
prss1
-0.050
CU655961.1
0.170
socs3a
-0.048
stmn2b
0.161
col6a2
-0.044
FP236734.1
0.160
clic4
-0.043
mettl11b
0.152
tpm4a
-0.043
chst12b
0.150
si:ch73-335l21.4
-0.042
FP236454.1
0.142
rps28
-0.042
gabrr3a
0.140
si:dkey-51e6.1
-0.040
elavl4
0.139
lmod1b
-0.040
cdx4
0.138
si:ch211-62a1.3
-0.039
CABZ01084961.1
0.137
tln1
-0.039
LOC101886471
0.135
bgnb
-0.039
gabrb4
0.135
CU929237.1
-0.038
ppp2r2ba
0.134
CELA1 (1 of many)
-0.038
CU655961.4
0.130
tagln
-0.038
CR936518.1
0.129
btg2
-0.037
aqp10b
0.129
pvalb2
-0.037
cngb3.1
0.127
cxcl14
-0.037
rtn1b
0.124
acta2
-0.037
si:ch211-218d20.15
0.124
egr1
-0.036
sdcbp
0.124
cebpd
-0.036
stmn2a
0.123
xbp1
-0.035
XLOC-006282
0.123
junba
-0.035
zgc:77784
0.123
lrrc17
-0.035
zgc:154064
0.122
MDFIC
-0.035
diras1a
0.121
kng1
-0.035
gpm6ab
0.121
zgc:158343
-0.035
si:dkey-148a17.6
0.121
parvab
-0.035
si:dkey-149m13.5
0.119
vclb
-0.035