Daniocell
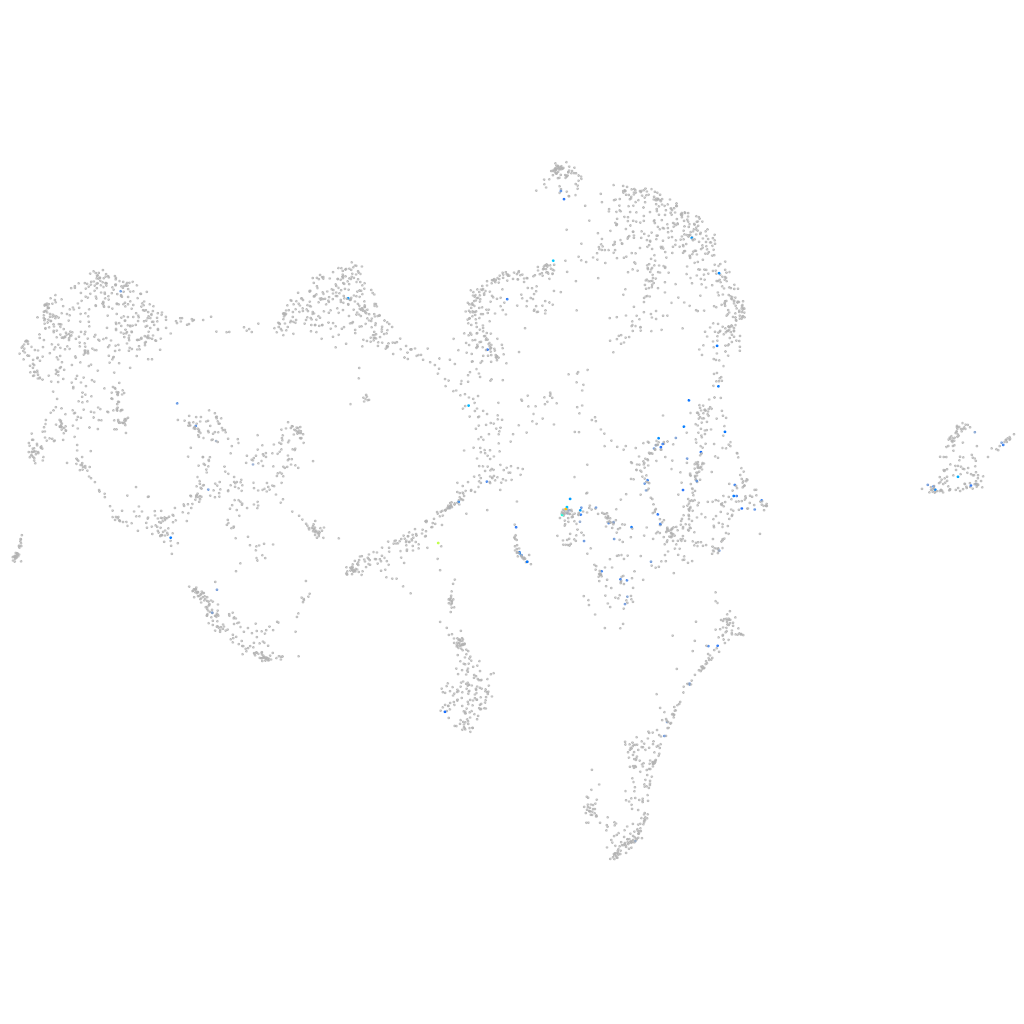
fgf12b (ionocytes / mucous-producing)
fibroblast growth factor 12b
ZFIN
Gene expression UMAP
Display:
Expression
Stage
Other cell groups
all cells
blastomeres
PGCs
endoderm
axial mesoderm
muscle
mural cells /
non-skeletal muscle
mesenchyme
hematopoietic /
vasculature
pronephros
neural
spinal cord / glia
eye
taste / olfactory
otic / lateral line
epidermis
periderm
fin
ionocytes / mucous
pigment cells
Expression by stage/cluster
Correlated gene expression
Positive correlation
Negative correlation
Gene
r
Gene
r
trim46b
0.325
selenow1
-0.105
XLOC-027892
0.316
ppl
-0.082
arf3a
0.312
si:ch211-195b11.3
-0.082
SIPA1
0.300
tob1b
-0.080
carmil3
0.298
zgc:153284
-0.080
slc18a3a
0.297
mgst1.2
-0.079
pcdh2g5
0.287
aldob
-0.078
pcdh1g13
0.283
wu:fb18f06
-0.078
aatkb
0.281
zgc:193505
-0.077
GABRA2
0.276
cst14b.1
-0.077
lrrn2
0.276
tdh
-0.077
fam131bb
0.256
pycard
-0.076
nlgn2b
0.254
cldne
-0.076
gpc1a
0.249
BX000438.2
-0.075
si:dkeyp-27e10.3
0.248
si:dkey-247k7.2
-0.075
SMIM18
0.243
znf185
-0.074
LOC103911600
0.242
zgc:162730
-0.073
fndc4b
0.241
si:ch211-79k12.1
-0.073
si:dkey-175g6.2
0.239
icn2
-0.072
CR931813.2
0.237
zgc:110333
-0.071
shisa9a
0.234
ezrb
-0.070
lhx1a
0.234
tuba8l2
-0.070
si:ch211-150g13.3
0.233
krt4
-0.069
znrd1
0.231
mcl1a
-0.069
ppm1nb
0.225
gstp1
-0.068
syt9a
0.225
soul2
-0.067
ntrk3b
0.224
capns1a
-0.067
nhsl2
0.223
zgc:175088
-0.067
syngr3a
0.223
mgst1.1
-0.067
LOC100330501
0.222
LOC799574
-0.066
gfra4b
0.221
evpla
-0.065
si:ch211-26b3.4
0.219
DSG2
-0.065
rftn1a
0.219
malb
-0.065
npas2
0.218
ier2b
-0.065
si:ch73-54f23.4
0.217
tmem45b
-0.065