Daniocell
fgf10b (mural cells / non-skeletal muscle)
fibroblast growth factor 10b
ZFIN
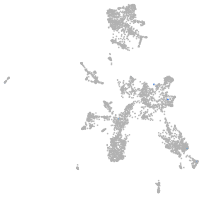
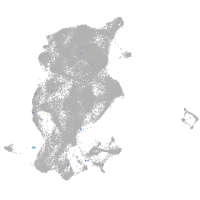
Gene expression UMAP
Display:
Expression
Stage
Other cell groups
all cells
blastomeres
PGCs
endoderm
axial mesoderm
muscle
mural cells /
non-skeletal muscle
mesenchyme
hematopoietic /
vasculature
pronephros
neural
spinal cord / glia
eye
taste / olfactory
otic / lateral line
epidermis
periderm
fin
ionocytes / mucous
pigment cells
Expression by stage/cluster
Correlated gene expression
Positive correlation
Negative correlation
Gene
r
Gene
r
si:dkey-22i16.9
0.250
XLOC-041870
-0.092
si:ch211-226h8.14
0.243
XLOC-025423
-0.075
CT025854.1
0.232
aoc2
-0.063
si:ch73-343l4.2
0.230
cfd
-0.054
spi2
0.217
tagln
-0.054
myl7
0.212
nkx2.3
-0.053
si:dkey-83f18.10
0.205
tpm1
-0.053
si:ch211-238e22.8
0.203
si:dkey-56m19.5
-0.052
si:dkey-83f18.11
0.198
XLOC-028370
-0.052
nanog
0.196
si:ch211-62a1.3
-0.052
si:dkey-276j7.2
0.195
prdx1
-0.051
cib3
0.195
BX322618.1
-0.050
LOC103909475
0.195
XLOC-002639
-0.049
LOC103911723
0.195
si:dkeyp-66d1.7
-0.049
sostdc1b
0.195
hlx1
-0.049
XLOC-043919
0.188
BX908750.1
-0.048
twist1b
0.175
foxf1
-0.047
slc46a3
0.173
BX088707.3
-0.046
CR388378.1
0.173
rgs5a
-0.046
ftr87
0.173
nptna
-0.045
LOC108183287
0.173
BX901920.1
-0.045
znf1133
0.169
pmp22a
-0.042
XLOC-024825
0.167
myl9a
-0.042
LOC100329676
0.167
BX005183.3
-0.042
LOC101882378
0.167
zgc:153704
-0.041
si:dkey-15j16.6
0.166
rbp4
-0.041
arsg
0.163
igfbp7
-0.040
si:ch211-208f21.3
0.162
pdgfrb
-0.038
si:dkeyp-4c4.2
0.161
parvab
-0.038
gaa
0.161
col6a2
-0.037
LOC103910198
0.160
tpm2
-0.037
zgc:113442
0.160
pik3r2
-0.037
si:ch211-133n4.12
0.158
col1a1b
-0.037
il12a
0.157
selenbp1
-0.037
si:ch211-117c9.1
0.154
desmb
-0.037